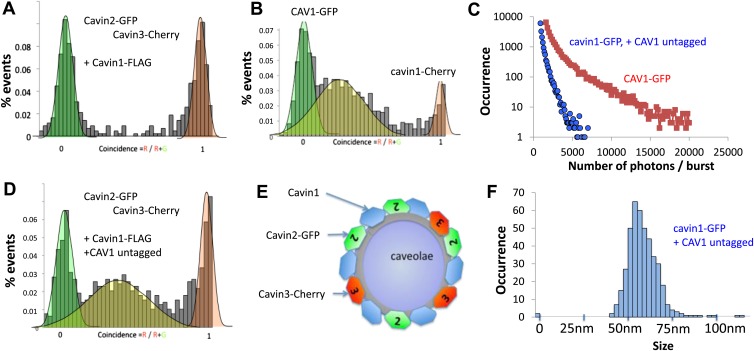
Figure 3. Single-molecule counting and coincidence analysis of cavin oligomerization in MCF-7 cells in the presence of CAV1.
(A) Histogram of single-molecule coincidence between cavin2-GFP and cavin3-Cherry in MCF-7 cells co-expressing cavin1. The lack of coincidence (0.25<coincidence<0.75) demonstrates that cavin2 and cavin3 do not interact even in the presence of cavin1. (B) Histogram of single-molecule coincidence between CAV1-GFP and Cavin1-Cherry. The distribution shows a large peak of coincidence centered around C = 0.25, indicating that cavin1 localizes on caveolae with approx. three CAV1 molecules for one molecule of cavin1. (C) Distribution of burst brightness from MCF-7 cells transfected with CAV1-GFP (shown in red) or cavin1-GFP and CAV1 untagged (in blue). The brightness of CAV1-GFP is typically 3.5 higher than the brightness of cavin1-GFP. (D) Histogram of single-molecule coincidence between cavin2-GFP and cavin3-Cherry in MCF-7 cells when both cavin1 and CAV1 are co-expressed. (E) Schematic representation of the co-localization of cavin2 and cavin3 when cavin1 and CAV1 are co-expressed, indicating that the two subcomplexes are assembled on the caveolae. (F) Histogram of apparent single-molecule sizes of cavin1-GFP co-expressed with CAV1 (untagged). The size distribution is centered around the size of caveolae, suggesting that the cavin1 complex wraps around caveolae without significantly increasing its apparent size.
Figure 3—figure supplement 1. Effect of co-transfection of CAV1 in MCF-7 cells on the size and brightness of cavin1-GFP oligomers.
Figure 3—figure supplement 2. Single-molecule coincidence analysis of cavin interactions in HeLa cells.
Figure 3—figure supplement 3. Localization of Cavin 2-Cherry and Cavin 3-GFP in MDCK cells.


