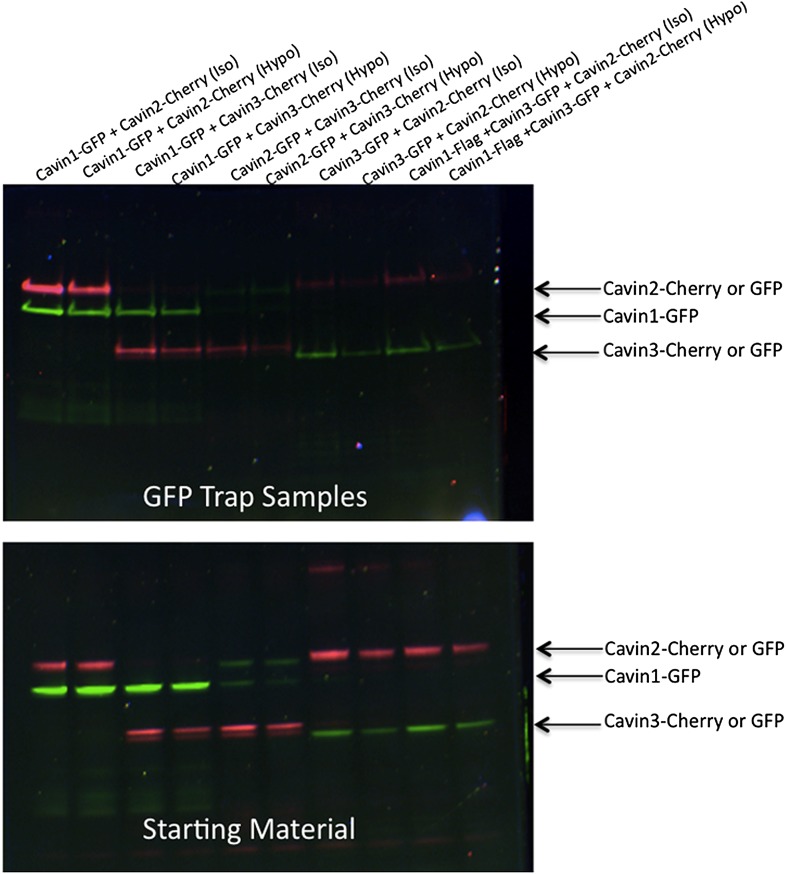
Figure 4. Dissociation of the cavin coat upon cell swelling induced by hypo-osmotic treatment.
(A) Histogram of apparent single-molecule sizes for cavin1-GFP before (green) and after (grey) membrane stretching induced by hypo-osmotic treatment. The size of observed cavin1 oligomers decreases from 60 nm to 20 nm. (B) Histogram of single-molecule coincidence for cavin1-GFP and cavin1-Cherry after hypo-osmotic treatment. We observe that solubilized cavin1 remains oligomeric as all bursts contain both GFP and Cherry fluorophores. (C) Burst brightness distribution for cavin1-GFP (green) and cavin1-Cherry (red) in oligomers released from the membrane upon hypo-osmotic treatment. Oligomers contain GFP and Cherry in equal amounts; the total fluorescence indicates that the sub-oligomers are typically made of 8–10 cavin1 proteins and hence significantly reduced in size compared to the isotonic conditions (Figure 1). (D) Histogram of single-molecule coincidence between cavin2 and cavin1 after hypotonic treatment. Data show that all cavin2 are bound to cavin1 but approximately 15% of the oligomers contain cavin1 only. (E) Histogram of single-molecule coincidence between cavin3 and cavin1 after membrane stretching. Data show that all cavin3 are bound to cavin1 and approx. 20% of cavin1-only oligomers are observed. (F) Histogram of single-molecule coincidence between cavin2 and cavin3 after membrane stretching. The absence of coincidence suggests that while cavin2 and cavin3 can localize to the same caveolae, their release from the membrane during stretch causes them to separate into two different subcomplexes. (G) Histogram of apparent single-molecule sizes obtained after hypo-osmotic treatment for cavin1-GFP, cavin2-GFP and cavin3-GFP, in the presence of co-expressed cavin1-Cherry. The measurements indicate that the cavin1-cavin1 and cavin1-cavin3 subcomplexes are very similar in size (average of 20 nm), but the apparent size of the cavin1-cavin2 subcomplex is higher with an average of 30 nm. (H) Model of cavin1-cavin1, cavin1-cavin2 and cavin1-cavin3 subcomplexes dissociation from CAV1 domains upon membrane stretching mediated by cell swelling.


