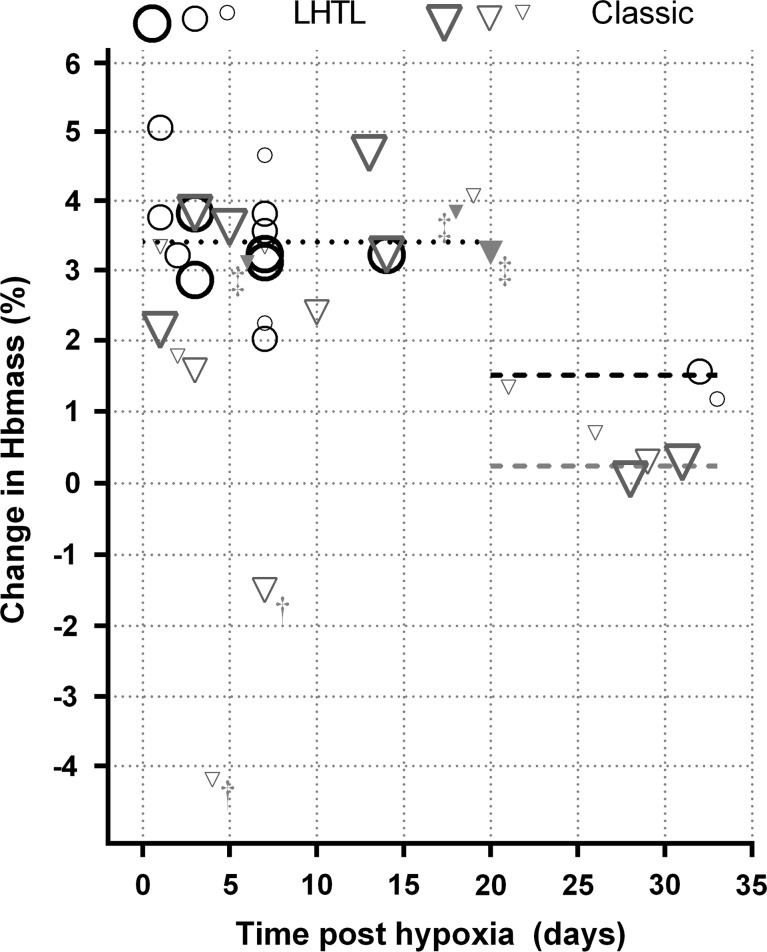
Figure 2.
Estimates of the change in haemoglobin mass (Hbmass) after live high train low (LHTL, n=15) and classic (n=21) altitude exposure. The relative weightings of estimates are indicated by symbol size and border thickness—the largest symbols are for the highest weighted studies which have the smallest SEs. †Outliers, the estimate at day 4 from Frese and Friedmann-Bette,28 and the estimate at day 7 from Neya et al.24 ‡The other three estimates from Frese and Friedmann-Bette28 (classic altitude and filled triangles) omitted from the reported analysis. Dotted (≤20 days) and dashed (>20 days) lines are the modelled estimates indicated in table 3.

