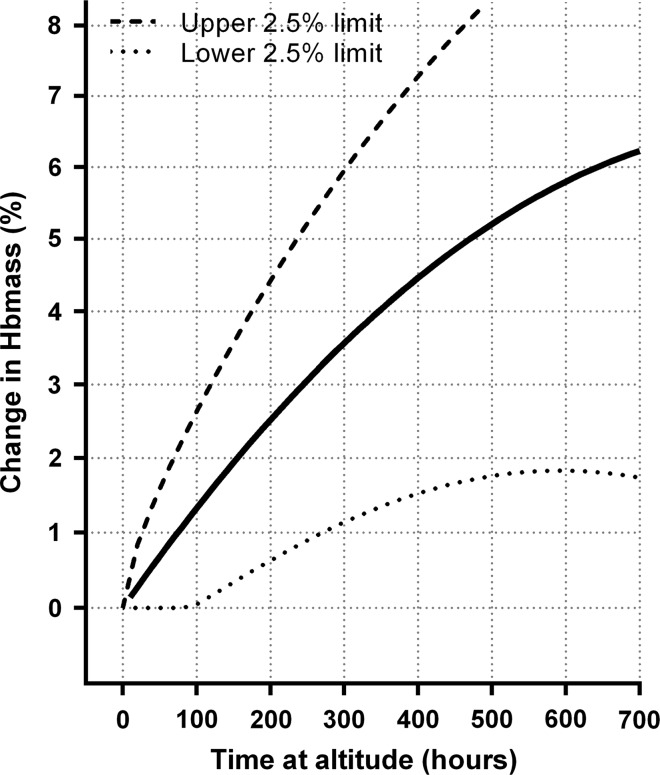
Figure 4.
Estimated median and estimated between-subject ‘true’ change in haemoglobin mass (Hbmass) in response to altitude exposure. The solid line refers to the same quadratic model as in figure 1 with dashed lines being the upper and lower 95% individual response limits. Where the lower limit of the individual responses was estimated to be negative, it has been truncated at zero.

