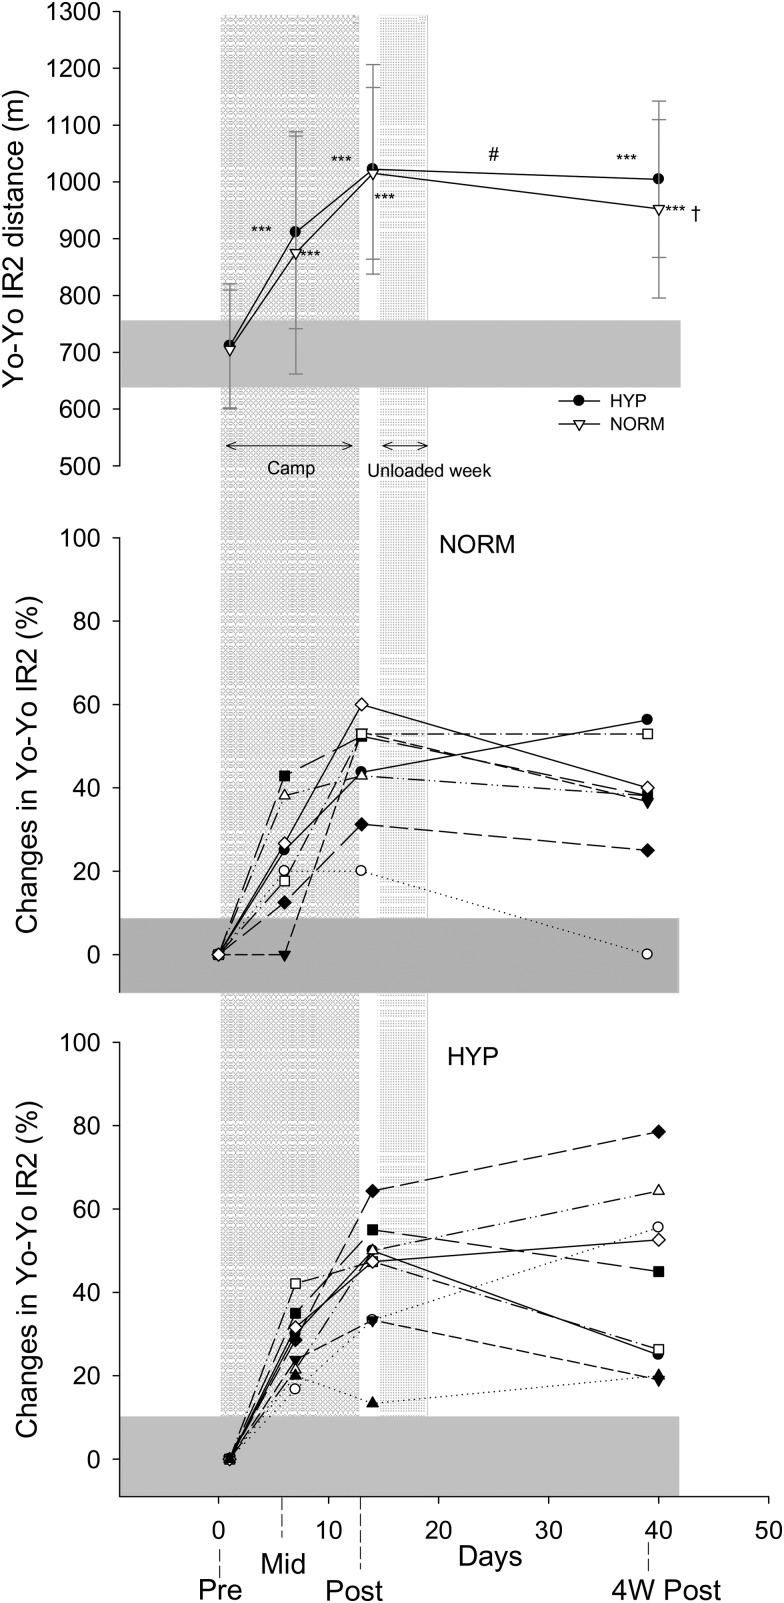
Figure 2.
Performance responses to the camp. Mean (SD) values (upper panel) and individual relative changes (middle and lower panel) in Yo-YoIR2 during the camp and the following 4 weeks in players belonging to the normoxic (NORM) or hypoxic exposure (HYP) groups. ***, Almost certain within-group difference versus Pre (ie, day 0). †, Likely within-group difference versus Post (ie, day 13). #, Possible between-group difference in the change (4WPost vs Post). The grey horizontal area represents the typical error of measurement of the test (ie, 10%23).

