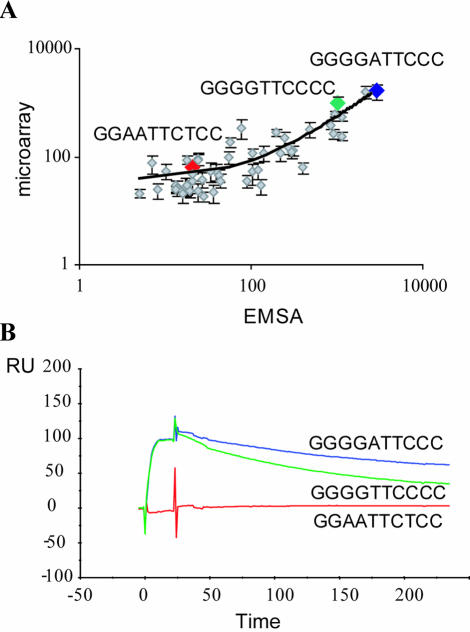
Figure 2.
Sensitivity of an NF-κB TF binding to DNA microarrays. (A) All NF-κB p52 microarray binding data were normalized against the GGGGTTCCCC sequence, which was given a value of 1000. EMSA binding data are from Nijnik et al. (13). Quadratic polynomial regression fitted the data best, with 93% correlation. Sequences GGGGATTCCC (blue dot), GGGGTTCCCC (green dot) and GGAATTCTCC (red dot) are discussed in the text. Error bars indicate the standard error. (B) SPR analysis of real-time association and dissociation rates for protein–DNA interactions. No binding between duplex GGAATTCTCC and NF-κB p52 could be detected (red line). p52 had an approximately three times slower dissociation rate from duplex GGGGATTCCC (blue line) than from duplex GGGGTTCCCC (green line), whereas association rates were similar.

