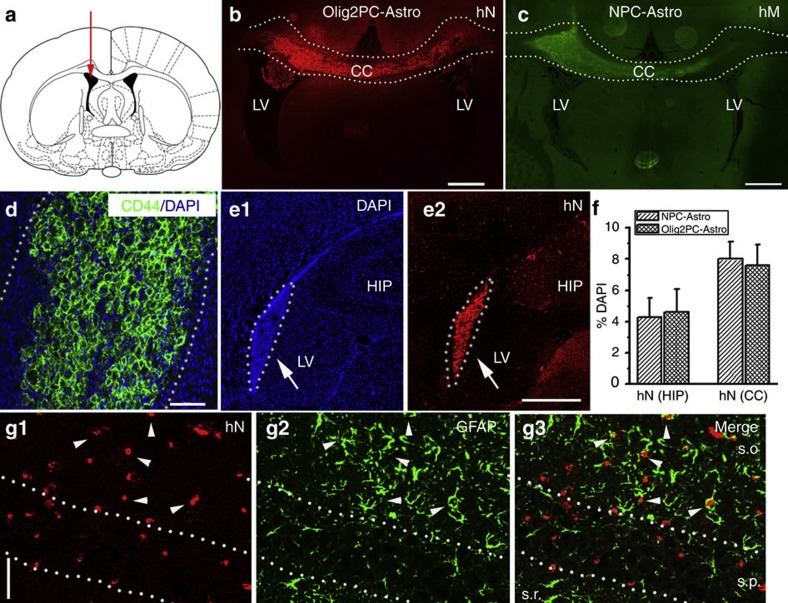
Figure 5. Transplantation of human astroglia into rat brains subjected to GCI.
(a) Diagram showing the intraventricular transplantation site. (b and c) Representative images showing that at 7 days after transplantation, the transplanted Olig2PC-Astros (b) and NPC-Astros (c) were identified by human nuclei (hN) and human mitochondria (hM) staining. Notably, the majority of the transplanted astroglia were found around at the injection site and the corpus collusum (CC). Dotted lines highlight CC. LV: lateral ventricle. Scale bars represent 100 μm. (d) A representative image from Olig2PC-Astro transplantation group showing that the transplanted astroglia were also labelled by human CD44. Dotted lines highlight CC. Blue, DAPI-stained nuclei. Scale bar represents 50 μm. (e1–2) The transplanted Olig2PC-Astros were also found in the ventricle and the hippocampus (HIP) region. Dotted lines highlight that some of the transplanted Olig2PC-Astros accumulated in the LV. e1, DAPI; e2, hN. Scale bar represents 100 μm. (f) Quantitative results from brain sections containing structures of the HIP and CC showing that no difference in engraftment success (hN+ cells) was noted between Olig2PC-Astro and NPC-Astro transplantation groups (n=7–8). Data are represented as mean±s.e.m. (g1–3) Representative images from the hippocampal CA1 region showing that the transplanted Olig2PC-Astros migrate into the CA1 region and express GFAP. d1, hN; d2, GFAP. Arrowheads in d3 indicate the cells double labelled with hN and GFAP. s.o., stratum oriens; s.p., stratum pyramidale and s.r., stratum radiatum. Scale bar represents 50 μm.

