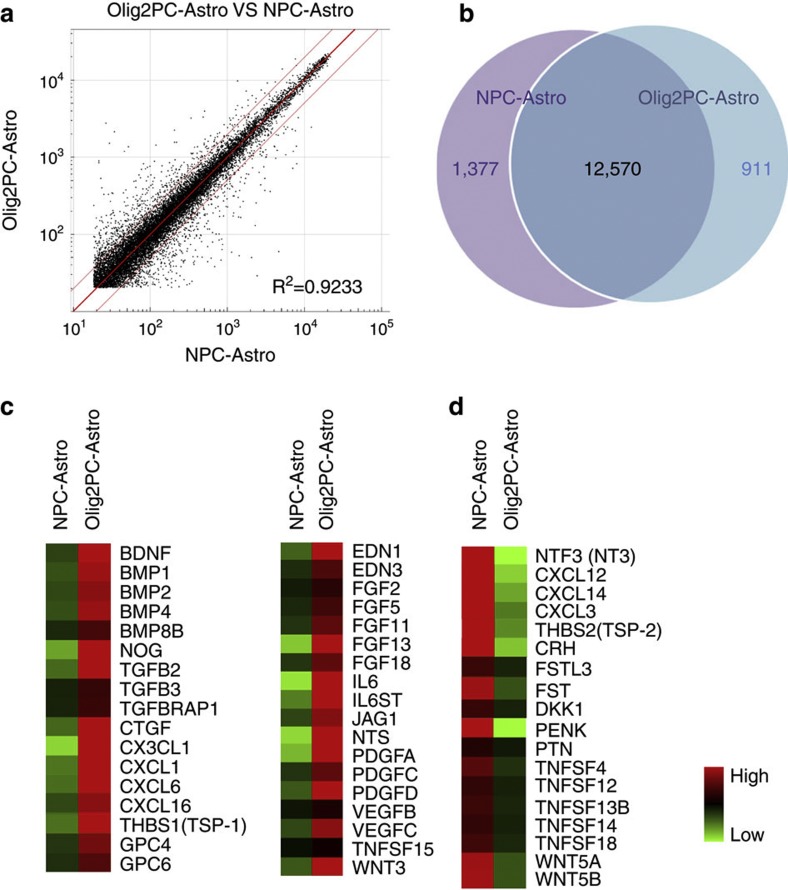
Figure 8. Gene expression analysis of NPC-Astros and Olig2PC-Astros.
(a) Scatter plot showing the similarity of the NPC-Astro and Olig2PC-Astro populations. (b) Venn diagram showing the number of genes commonly or differentially expressed in the two populations of astroglia. (c–d) Heat maps showing differential gene expression of representative genes encoding factors secreted by NPC-Astros and Olig2PC-Astros. High detection signals relative to the mean were coloured in red. Low detection signals were coloured in green.

