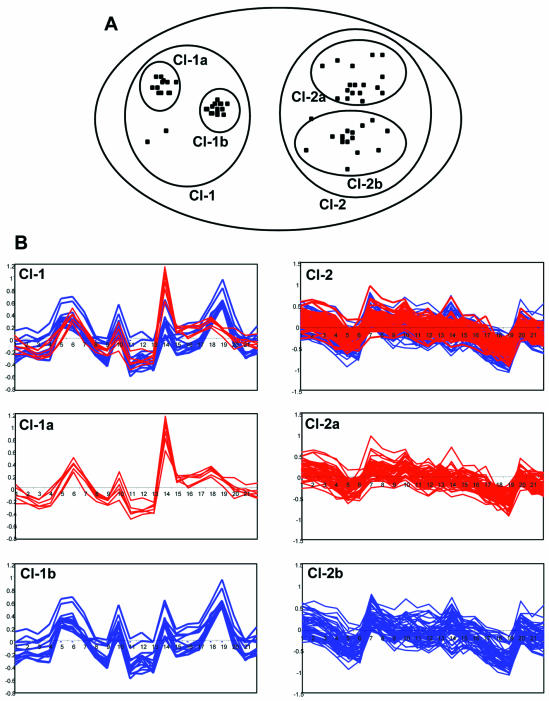
Figure 1.
Nested clustering of gene expression profiles. (A) Two-dimensional representation of the nested clustering procedure. The gene expression profiles are shown as separate points in a two-dimensional space. Higher level cluster 1 (Cl-1) contains two compact lower level clusters, Cl-1a and Cl-1b. Higher level cluster 2 (Cl-2) contains two poorly separated lower level clusters, Cl-2a and Cl-2b. (B) Actual expression profiles of genes included in Cl-1 and 2. The x-axis shows the hybridization experiments and the y-axis shows the ln of values of differential expression. See text for details.

