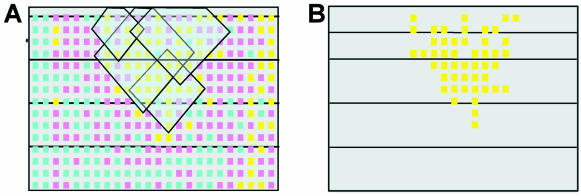
Figure 2.
Automatic identification of patterns using a city-block distance. (A) An example of the distribution of differential expression values over a slide. Yellow, blue and pink spots have differential expression values belonging to high value (>2), low value (<0.5) or intermediate value intervals, respectively. Semi-transparent rhombi represent some of the optimal city-block neighborhoods of spots with high values of differentials. The interconnected union of these rhombi constitutes a ‘pattern zone’. (B) Detected pattern of high differentials; the spots with high differential expression values that were covered by a detected ‘pattern zone’.

