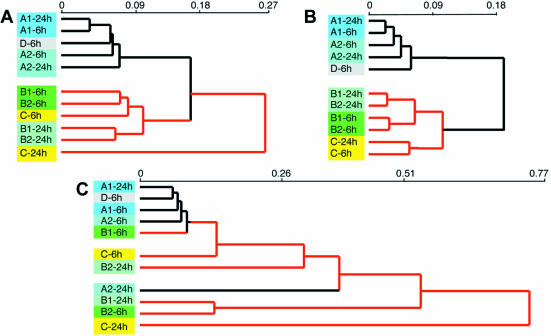
Figure 4.
Influence of gene sorting according to the KS criterion of biological quality on hierarchical clustering of probes. (A) Hierarchical clustering of probes within the hybridization set according to gene expression profiles of all 10 000 genes printed on the microarray. (B) Hierarchical clustering of probes within the same hybridization set according to expression profiles of 6283 genes with a median KS P-value ≥0.2, predicted to have biological expression profiles. (C) Hierarchical clustering of probes within the same hybridization set according to expression profiles of 1847 genes with a median KS P-value ≤0.001 predicted to have artifactual expression profiles. Probes: A1, PDGFβ 1 ng/ml; A2, PDGFβ 10 ng/ml; B1, TGFβ 1 ng/ml; B2, TGFβ 10 ng/ml; C, hypoxia (0.5% O2, 5% CO2). For details, see text.

