Figure 5.
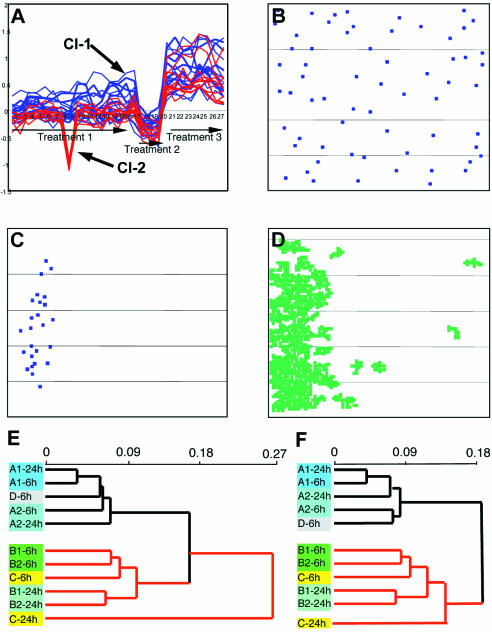
Application of weighted measure of distance for clustering of gene expression profiles and hierarchical clustering of hybridizations. (A) A cluster obtained from the application of the weighted clustering procedure represents a combination of two otherwise separated clusters (shown in blue and red). The x-axis shows the hybridization probes and the y-axis shows the ln of values of differential expression. (B) Microarray distribution of spots corresponding to the genes within the ‘blue’ cluster. (C) Microarray distribution of spots corresponding to the genes within the ‘red’ cluster. (D) Pattern of low differentials on the slide corresponding to probe 8. (E) Hierarchical clustering of probes within the hybridization set according to gene expression profiles of all 10 000 genes printed on the microarray (same as shown in Fig. 4A). (F) Hierarchical clustering of the same hybridization set using a weighted measure of distance, based on the expression profiles of all 10 000 printed genes. Note the improvement of the probe clustering in accordance with the underlying biological conditions (for details, see the text and the legend to Fig. 4).

