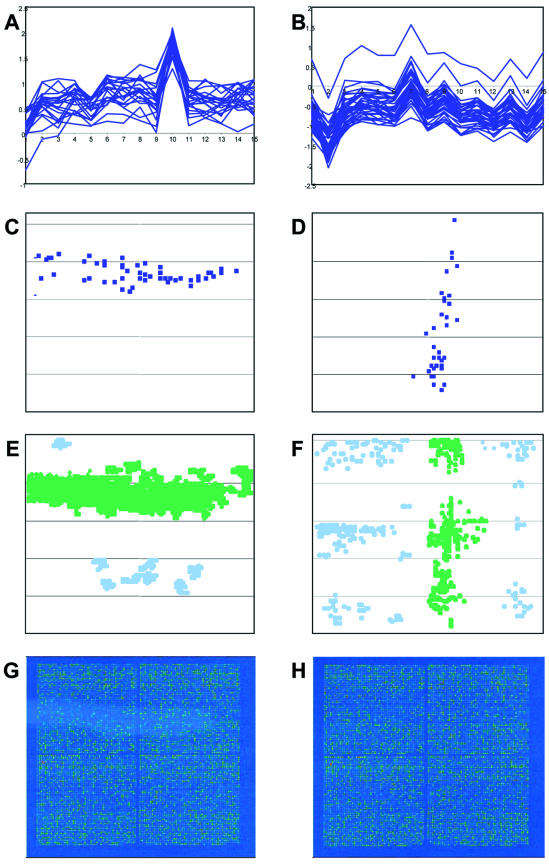
Figure 6.
Coincidence of microarray distribution of artifactual clusters with the zones of patterns of differential expression values. (A and B) Two gene clusters detected in the same microarray experiment, comprising 15 hybridizations. The x-axis shows the hybridization probes and the y-axis shows the ln of values of differential expression. (C and D) Microarray distribution of spots corresponding to the genes included in the clusters shown in (A) and (B), respectively. (E and F) Patterns of differentials appearing on the slides corresponding to hybridizations 10 and 2, respectively. The patterns whose position coincides with the microarray distribution of clusters shown in (A) and (B) are colored green. (G and H) Deduced Cy5 microarray images of slides corresponding to hybridizations 10 and 2, respectively.

