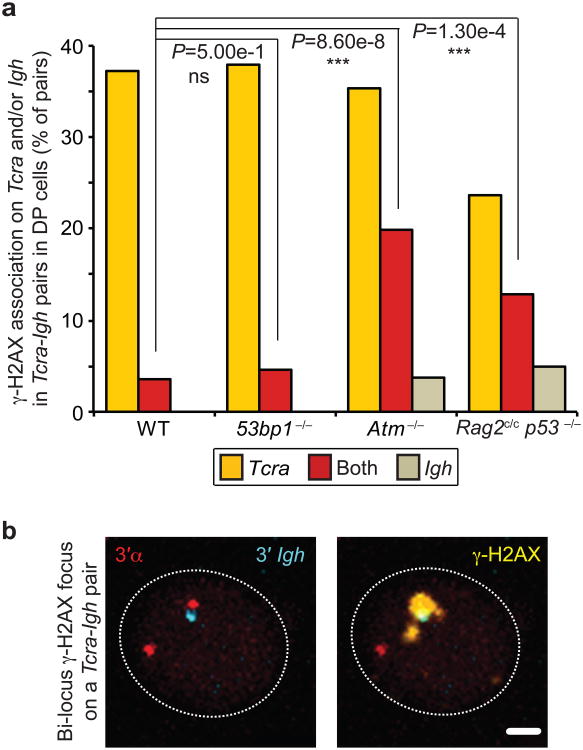
Fig. 4. RAG2 C-terminus and ATM control cleavage on Tcra-Igh pairs.
(a) Frequency of γ-H2AX association on Tcra and/or Igh in Tcra-Igh pairs in WT, 53bp1−/−, Atm−/−and Rag2c/c p53−/− DP cells. (b) Confocal sections showing a representative example of Tcra-Igh pair with a γ-H2AX focus on both loci. 3′α in red, 3′Igh in blue and γ-H2AX in yellow. Scale bar = 1 μm. P-values were calculated using a two-tail Fisher exact test (-ns- no significance (P ≥ 5.00e-2), -*- significant (5.00e-2 > P ≥ 1.00e-2), -**- very significant (1.00e-2 > P ≥ 1.00e-3), -***- highly significant (P < 1.00e-3)). Experiments were repeated at least two times and data are displayed as a combination of two independent experimental sets (n > 80 for each genotype; See Supplementary Table S6 for details and individual data sets).

