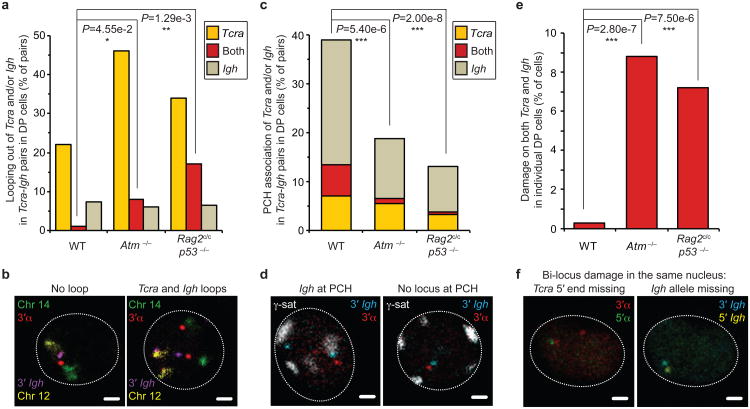
Fig. 6. Regulation of RAG cleavage is linked to genome stability.
(a) Frequency of higher-order looping out of the 3′ ends of Tcra and/or Igh in Tcra-Igh pairs in WT, Atm−/−and Rag2c/c p53−/− DP cells. (b) Confocal sections showing examples of Tcra-Igh pairs with no loop or looping of both Tcra and Igh. 3′α in red, 3′Igh in purple, chromosome 14 in green and 12 in yellow. Scale bars = 1 μm. (c) Frequency of PCH association of Tcra and/or Igh in Tcra-Igh pairs in WT, Atm−/−and Rag2c/c p53−/− DP cells. (d) Confocal sections showing representative examples of Tcra-Igh pairs with Igh located at PCH or no locus at PCH. 3′α in red, 3′Igh in blue and γ-satellite (PCH) in white. Scale bars = 1 μm. (e) Frequency of cells with bi-locus damage on both Tcra/d and Igh alleles in individual WT, Atm−/−and Rag2c/c p53−/− DP cells. (f) Confocal sections showing a representative example of bi-locus damage on both Tcra and Igh alleles in the same nucleus. One Tcra 5′ end and one Igh allele are missing. 3′α in red, 5′α in green, 3′Igh in blue and 5′Igh in yellow. Scale bars = 1 μm. P-values were calculated using a two-tail Fisher exact test (-ns- no significance (P ≥ 5.00e-2), -*- significant (5.00e-2 > P ≥ 1.00e-2), -**- very significant (1.00e-2 > P ≥ 1.00e-3), -***- highly significant (P < 1.00e-3)). Experiments were repeated at least two times and data are displayed as a combination of two independent experimental sets (n > 50 for each genotype; See Supplementary Tables S8-S10 for details).

