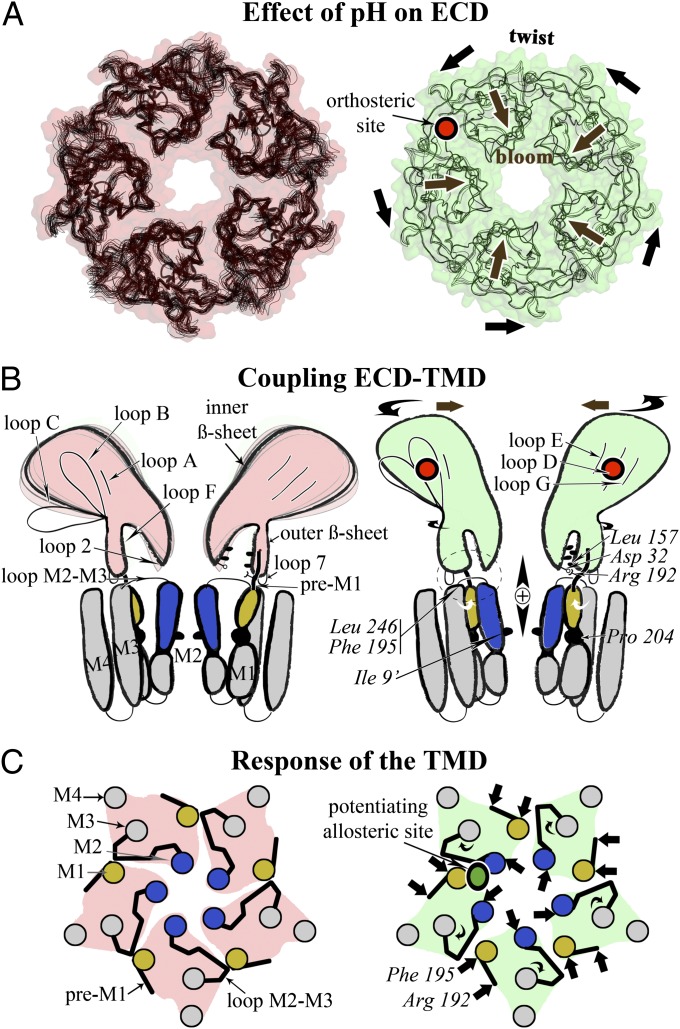
Fig. 4.
A sequential model for the activation of pLGICs. (A) The reduced flexibility in the ECD when going from the pH 7 form (Left, pink) to the pH 4 form (Right, green) is illustrated with superimposed atomic models. The quaternary associated twist and bloom motions are indicated with black arrows. The binding site of the agonist is shown in red. (B) Changes of the ECD–TMD interface in both states are shown in a schematic way. Residues shown experimentally to be involved in these interactions are indicated. The top of M2 helix is in blue, and the N terminus of M1 is in yellow. (C) Schematic view from the top and down the C5 axis of the TMD conformation in both states. The binding site for a positive modulator (anesthetics) is shown in green.

