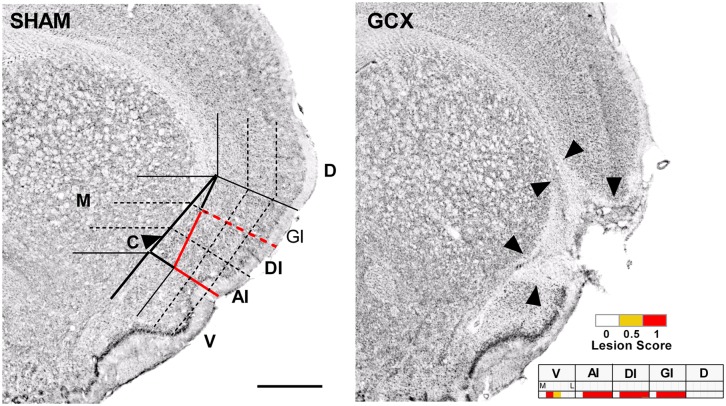
Fig. 2.
(Left) Example of the grid system displayed over the +1.2 mm coronal section of a representative SHAM section. See SI Materials and Methods for more detail on the definition of GC used and demarcation of subregions. GC is outlined in a solid red line. Abbreviations: AI, agranular insular cortex (dorsal to the rhinal fissure); C, claustrum (outlined column just medial to AI, GI, and DI); D, dorsal to insular cortex; DI, dysgranular insular cortex; GI, granular insular cortex; M, medial to claustrum; V, ventral to rhinal fissure; based on ref. 42. (Scale bar: 1.0 mm.) (Right) Representative GC lesion, the borders of which are noted by black arrowheads. (Inset) The corresponding mapping grid for this +1.2-mm section with lesion. Within each particular cell or subregion of the grid, if less than one-half the area was destroyed, then a lesion score of 0 was assigned (white). If at least one-half of the neuronal tissue of the grid cell was destroyed, then a lesion score of 0.5 was assigned (yellow). If the neuronal tissue in the entire grid cell was destroyed, then a lesion score of 1 was assigned (red).

