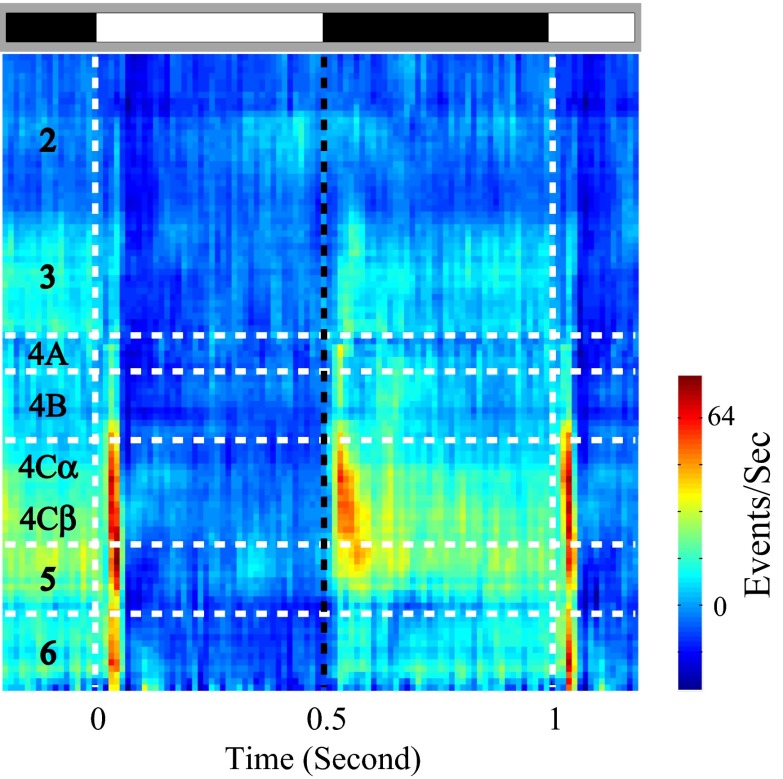
Fig. 2.
Laminar pattern of population responses (MUA) to black and white stimuli. Cycle-averaged MUA to black/white stimuli at different cortical depths (y axis) is represented by the color. At each cortical depth, the MUA is estimated by the averaged activity of the recording sites within ±0.05 mm around the cortical depth. Alternating black and white bars on gray background represent periods corresponding to black and white stimuli.

