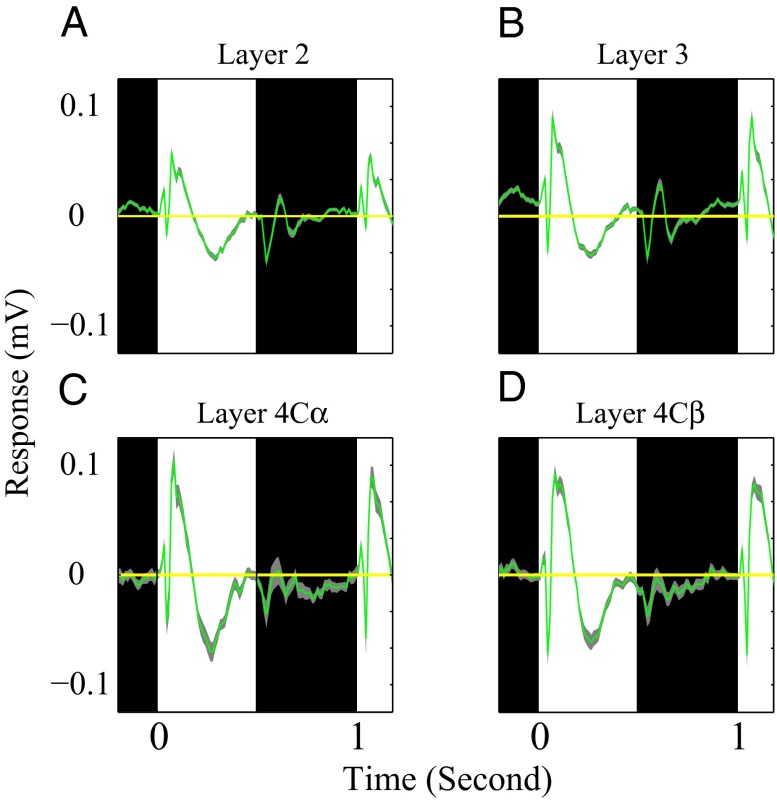
Fig. 4.
Average response dynamics of the LFP to black and white stimuli in different cortical layers. Population-averaged time course of LFP from all recording sites in layer 2 (n = 93), layer 3 (n = 95), layer 4Cα (n = 40), and layer 4Cβ (n = 71) are shown in A–D. In A–D, the period for black and white stimuli are represented by black and white regions. Yellow horizontal lines are averaged spontaneous LFP. The light gray curves represent 1 SEM for each population average LFP.

