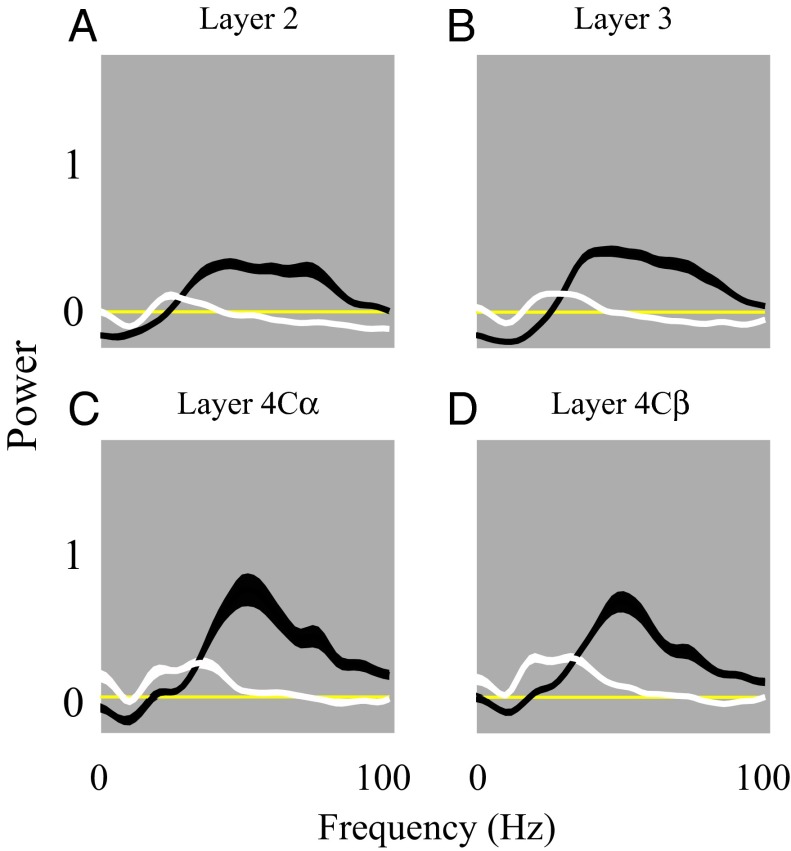
Fig. 5.
Average power spectra (LFP) to black and white stimuli in different cortical layers. Population-averaged power spectra of LFP from all recording sites in layer 2 (n = 93), layer 3 (n = 95), layer 4Cα (n = 40), layer 4Cβ (n = 71) depicted in plots A–D. In A–D, the black and white curves represent the visually induced power spectra of the LFP to black and white stimuli, respectively.

