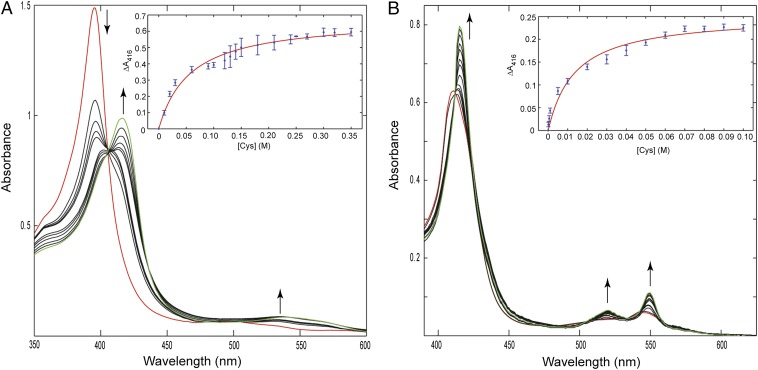
Fig. 3.
Changes in the absorption spectra of ferric (A) and ferrous (B) AcMP8 upon addition of AcCys in a 100 mM sodium phosphate buffer at pH 7.4. Traces shown in red are of AcMP8 with no AcCys present. The concentration range of AcCys was 0–300 mM for ferric and 0–90 mM for ferrous titrations; the last traces in the titration series are shown in green. (Insets) Binding curves from the titration data and their fits. The apparent binding constants from these measurements are (1.7 ± 0.4) × 101 and (7.3 ± 2.9) × 101 for the ferric and ferrous AcMP8, respectively. Taking into account the pKa of 9.5 for AcCys, the binding constant of Cys thiolate to ferric AcMP8 is ∼2.5 × 10³.

