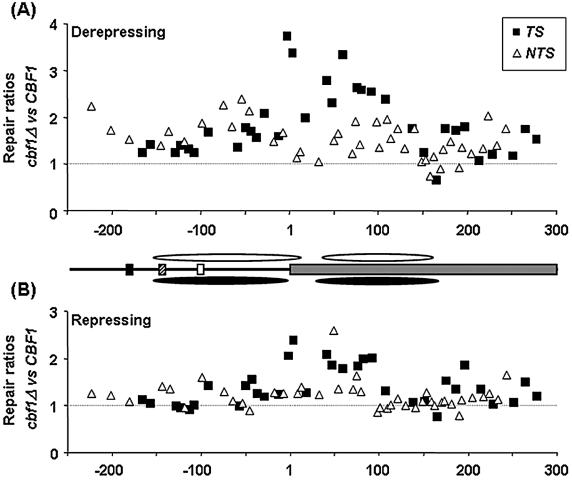
Figure 5.
Relative ratios of T50% values for CPD repair between CBF1 and cbf1Δ cells in the MET16 TS (squares) and NTS (triangles) in (A) derepressing and (B) repressing conditions. Values above 1 indicate faster repair in the CBF1 strain and those below 1 faster repair in the cbf1Δ mutant. Position 1 corresponds to the start of the coding region. Cbf1p binding site (black box), Gcn4p binding site (striped box), TATA-box (white box) and coding region (grey box). Approximate nucleosome positions according to the high resolution mapping of the MET16 TS are shown for the CBF1 (white ovals) and cbf1Δ strain (black ovals).

