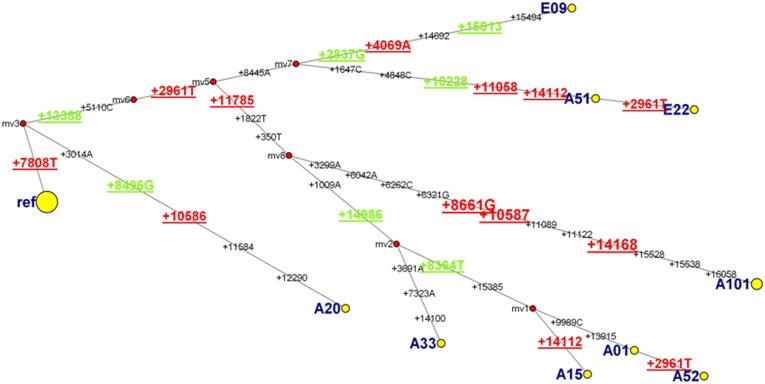
Fig. 4.
A median joining network representing all complete mtDNA sequences in A. cahirinus at EC. Numerals describe position of polymorphic sites. Nucleotide position in red and green refers to the positive and negative selections, respectively. Ref refers to the ES abundant haplotype Y1 (Table S3 gives details).

