Fig. 5.
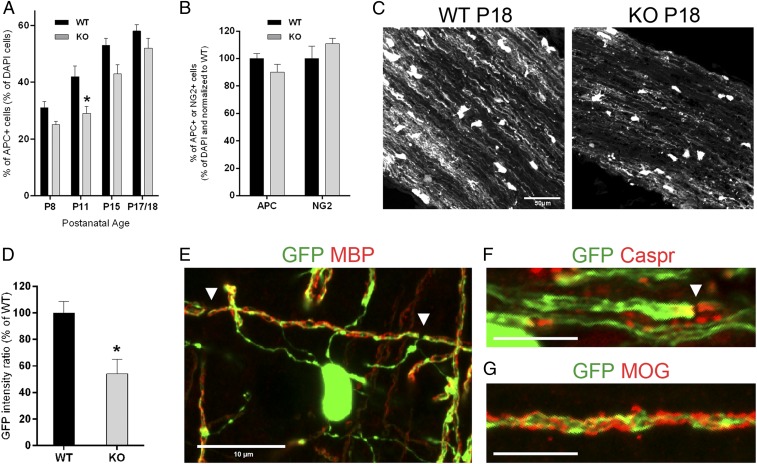
Impaired oligodendrocyte differentiation and myelin membrane expansion in Cntn1-KO optic nerves. (A and B) Oligodendrocyte maturation in WT and KO optic nerves was assessed by APC and NG2 immunostaining. (A) The graph shows the percentage of APC+/DAPI+ cells from P8 to P18 (P8, P = 0.08; P11, *P < 0.05; P15, P = 0.11, n = 3 for each condition; P17/18, P = 0.16, WT n = 10, KO n = 6). (B) The graph shows the percentage of APC+ and NG2+ cells normalized to WT levels at P17/18 (APC, P = 0.16, WT n = 10, KO n = 6; NG2, P = 0.45, n = 3). (C) Myelin membrane expansion was detected by GFP expression from the PLP promoter. (Scale bar, 50 µm.) (D) GFP fluorescence was reduced by ∼46% in Cntn1-KO compared with WT optic nerves at P18 (*P < 0.05, n = 4). (E) GFP signal colocalizes at myelin segments stained with MBP, demarcated by arrowheads. (F) GFP accumulates at paranodal regions, here marked with Caspr staining (arrowhead). (G) GFP signal distribution at myelin segments is also shown with MOG staining. (Scale bars in E–G, 10 µm.)

