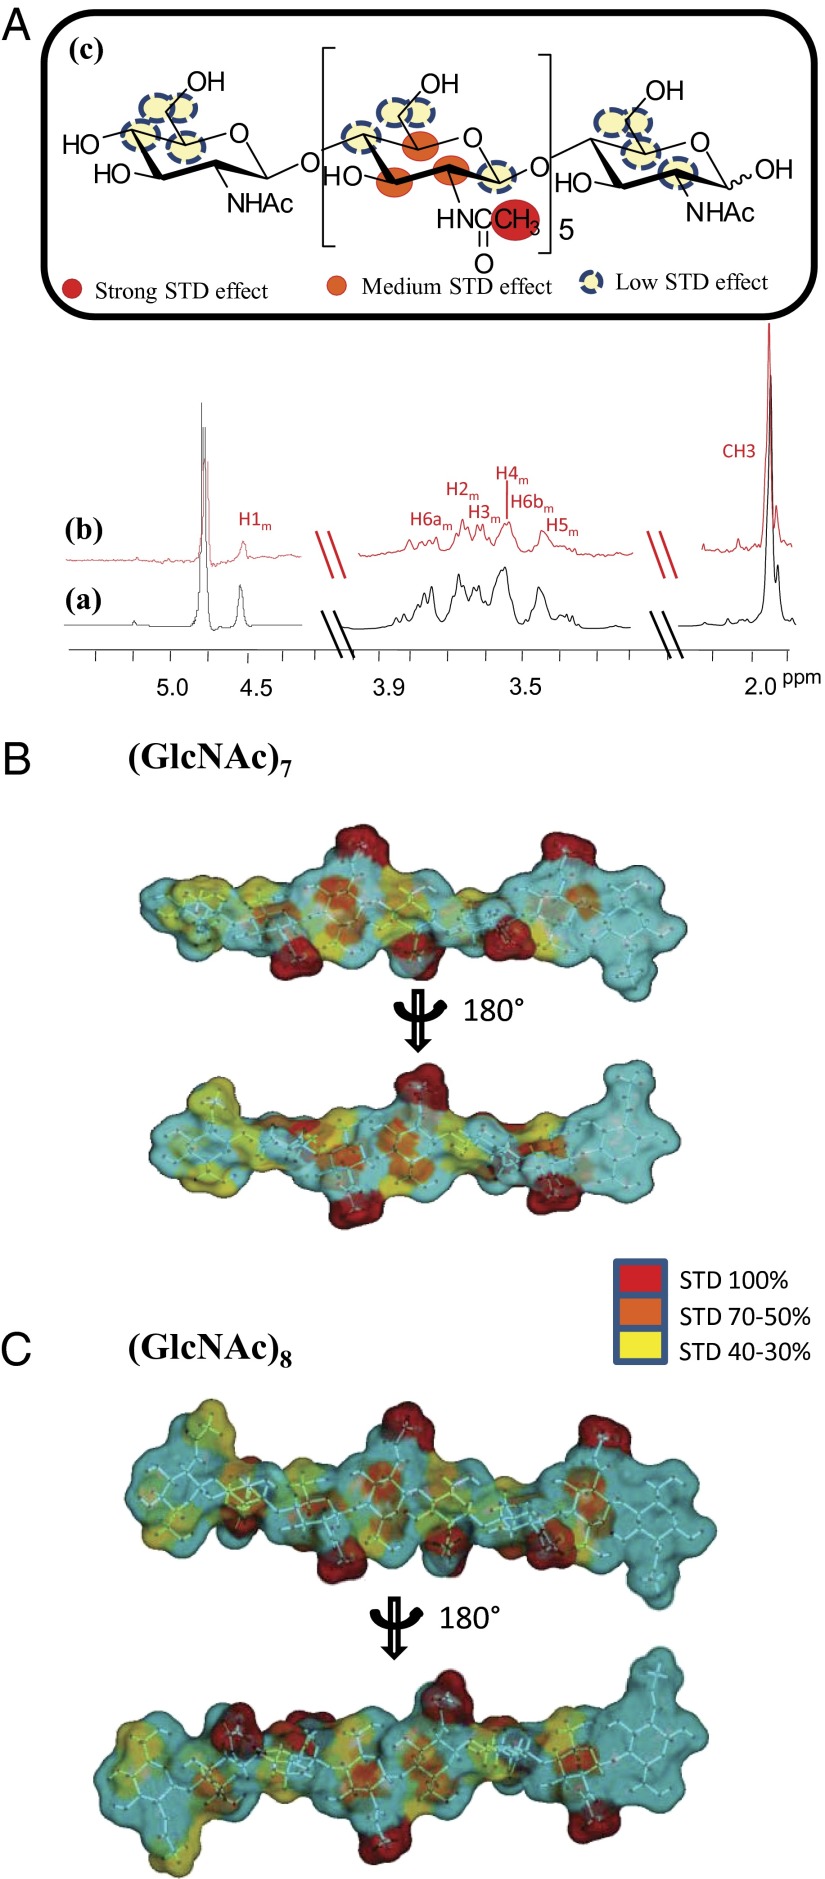
Fig. 3.
STD NMR-derived epitope mapping on (GlcNAc)7 and (GlcNAc)8 bound to Trx-LysM1-2. (A) Reference 1H NMR spectrum (a) and STDD NMR spectrum (b) of mixture Trx-LysM1-2: (GlcNAc)7 (1:100). (c) Chemical structure and epitope for binding of (GlcNAc)7 to Trx-LysM1-2; relative STD intensities are color coded according to the scale and refers to the relative STD effects as shown in SI Appendix, Table S2. (B and C) STD quantitative analysis-derived epitope mapping on the molecular envelope of (GlcNAc)7 and (GlcNAc)8 with color coding from the highest (red) to lowest (yellow) observed STD effect.

