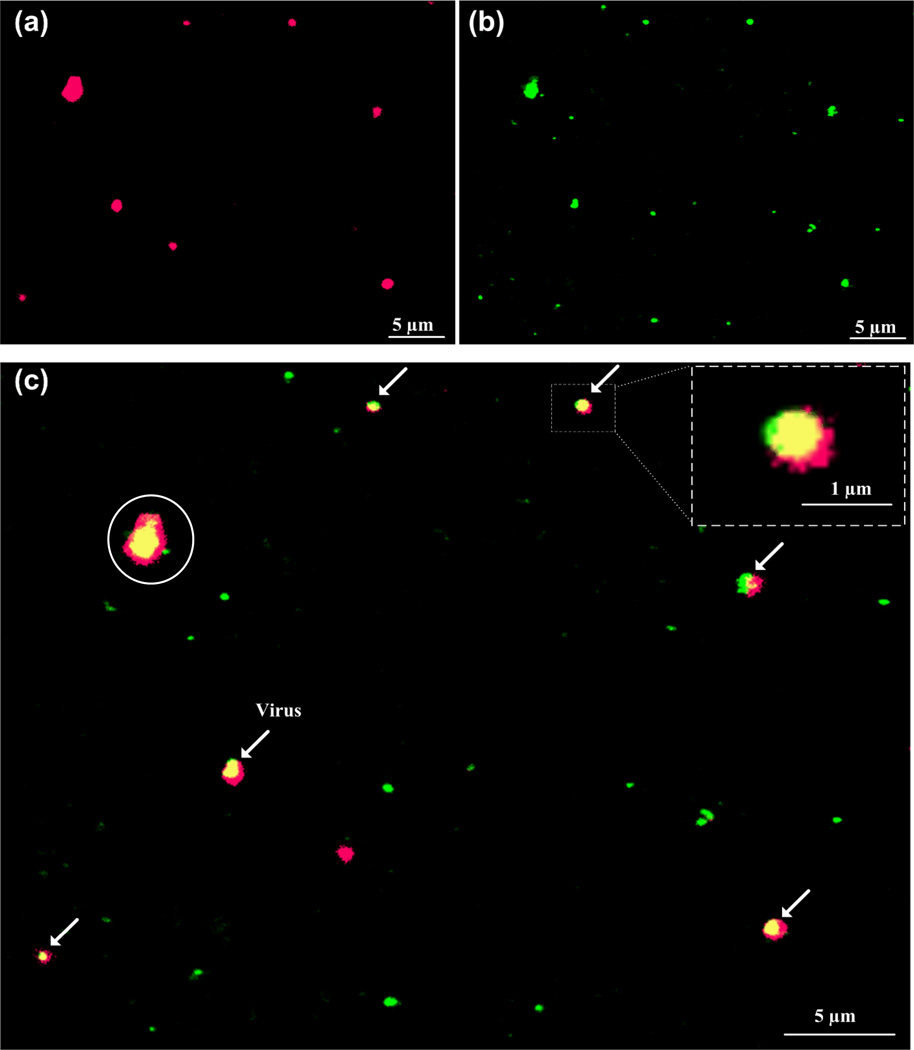
Figure 3.
Fluorescence detection of HIV-1 particles and automatic counting by ImageJ. Whole blood containing HIV-1 was injected into the microchannel and stained with two Qdot 525 (green) and 655 (red). (a) Virus particles viewed using Cy5 (red) filter. (b) Virus particles viewed using GFP (green) filter. (c) Merged pictures of a and b was performed using Axiovision software to co-localization of virus particles (in yellow), indicated by arrows. Scale bar is 5 µm except the one in the blow-up, in which it is 1 µm. Virus count was performed using ImageJ, with size threshold set within 300–700 nm to exclude non-specific detection (circled).

