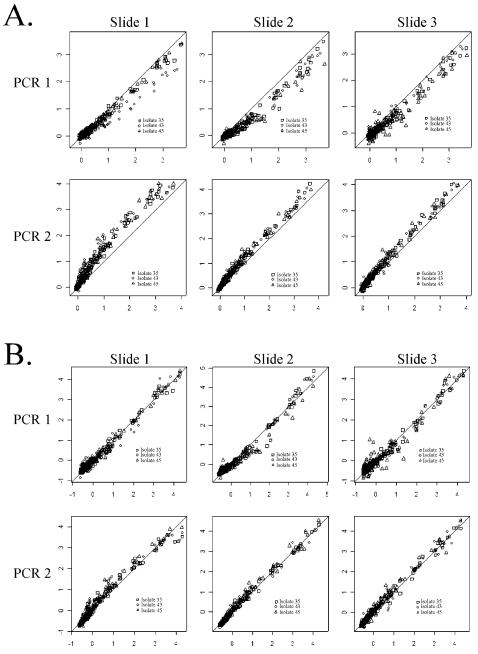
Figure 1.
Plots of median chip intensity (y-axis) versus median intensity over all chips (x-axis) for the ‘isolate block’ {36,43,45}before (A) and after (B) self-normalization. Plotting characters represent isolates. Before normalization, there appears to be a significant lot effect (A). The normalized plots (B) suggest that between slide repeatability is high and that a linear normalization is appropriate. The lots represent independent PCR preparations. The three slides (independent hybridizations) within a lot were prepared on three separate days.

