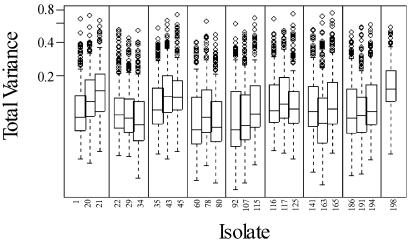
Figure 2.
Box plots of total variance for 192 probes, computed separately for each isolate. The median value is represented by a line within the rectangular box, which captures half of the 192 observations (the lower and upper edges of the rectangle represent the first and third quartiles, respectively). The ‘whiskers’ in each box plot extend to the extremes of the data, and very extreme points (individual probes with extremely high variance) are represented as individual data points (circles). Vertical lines delineate ‘isolate blocks’.

