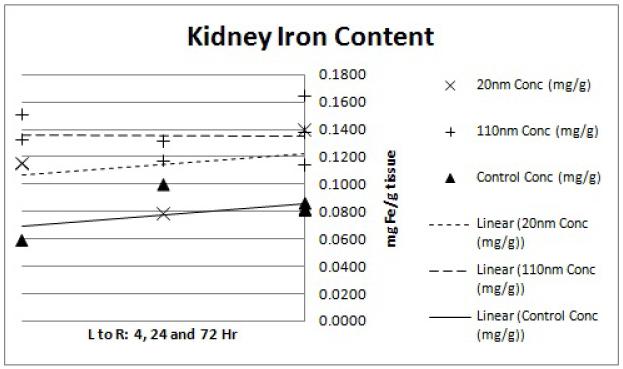
Figure 6.
ICP-MS kidney iron content. Each point represents the determined iron concentration of a sample from a single mouse. Linear regression trend lines were fitted to each nanoparticle size group (20nm, 110nm and water control) to observe the preliminary trends in concentration data. The x-axis shows the 4, 24 and 72hr time points from left to right while the y-axis shows ICP-MS-determined iron concentration of the tissue sample in mg Fe/g tissue weight.

