FIG 2 .
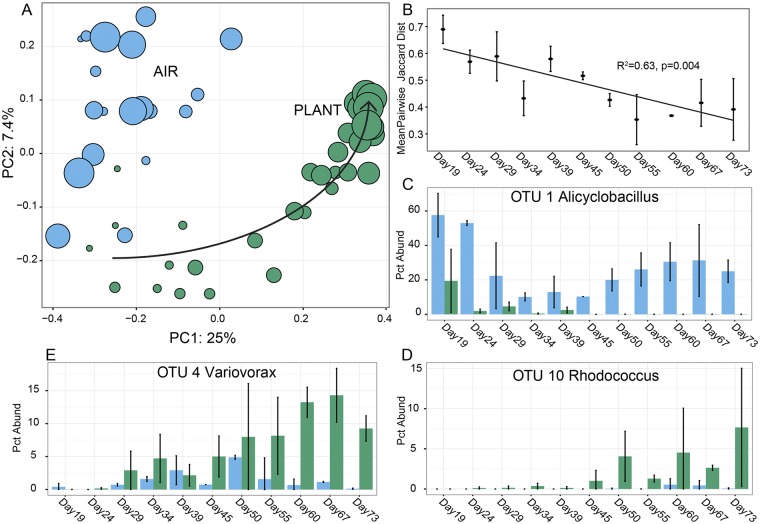
Mature plant-associated microbial communities have a distinct membership from air communities and show a clear trajectory over time. (A) Principal coordinate plots using the membership-based Jaccard index to measure beta diversity, based on OTUs clustered at 97% similarity. Each dot represents a single community (blue, air; green, plant). Dot size is scaled by sampling day (day 19, small; day 73, large). Arrow indicates the trajectory from early to mature phyllosphere communities. (B) Mean Jaccard distance between replicate plants on each sampling day shows increasing similarity with time. (C) Abundance trajectories over time of the day 60+ air biomarker OTU 1. Blue indicates relative abundance (percentage of total read count) in air, and green indicates relative abundance in plants. Error bars show the standard deviation across triplicates (plants) and duplicates (air). Abundance trajectories over time of day 60+ plant biomarker OTU 4, a day 55 biomarker (D), and OTU 10, a day 50 biomarker (E). Coloring is identical to that described for panel C.

