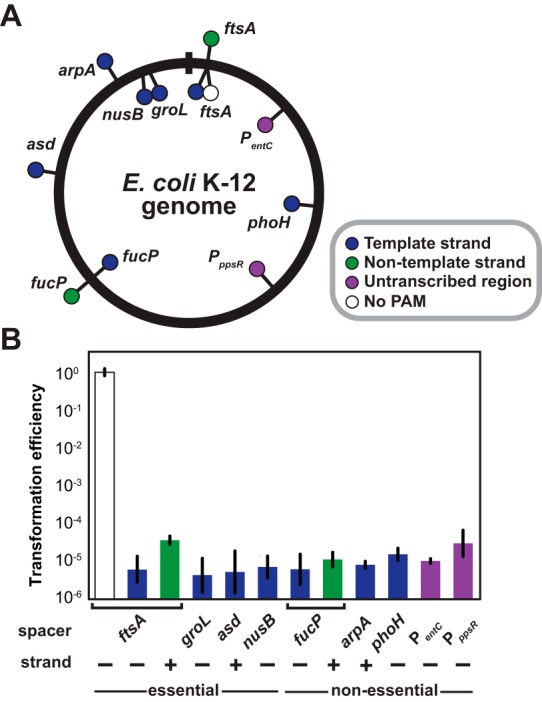
FIG 3 .

Similar efficiencies when targeting diverse locations throughout the genome. (A) Protospacer locations in the E. coli K-12 genome. Dots inside and outside the circle reflect spacers designed to base pair with the negative (−) or positive (+) strand of the chromosome, respectively. Dots also reflect protospacers flanked by a non-PAM (white), on the template strand (blue), or on the nontemplate strand (green) of coding regions or in nontranscribed regions (purple). (B) Transformation efficiencies for pCRISPR plasmids encoding spacers targeting the sites shown in panel A in BW25113-T7 harboring pCas3 and pCasA-E. See the legend for Fig. 2B for an explanation of the transformation efficiency. Values represent the geometric means and SEM of data from three independent experiments.
