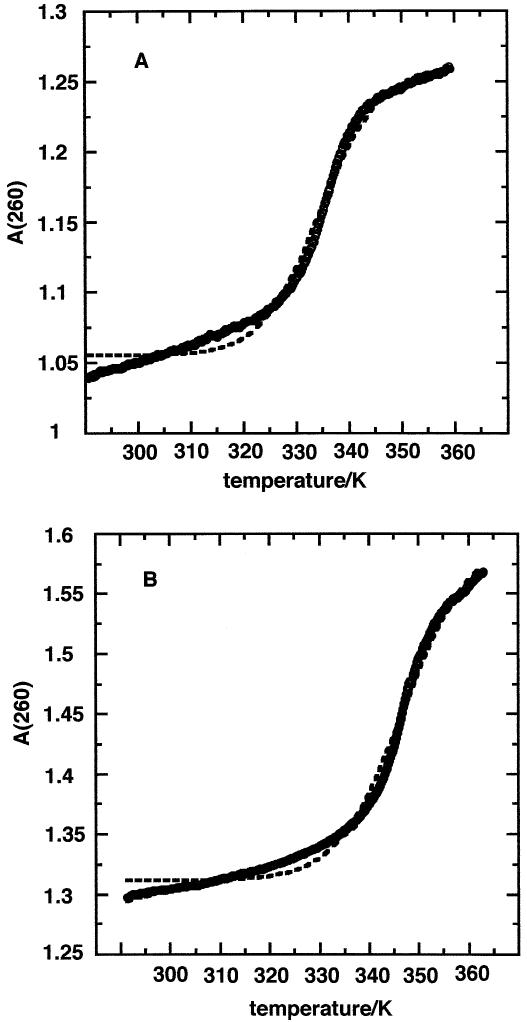
Figure 1.
UV melting of SECIS. The heating rate was 0.25°C/min with a sampling interval of 0.06°. The circles are experimental points, the dashed line is a fit to a model without sloping baselines and the solid line is a fit to a model with sloping baselines. (A) TrxR SECIS, Tm = 334 K. (B) GPX SECIS, Tm = 347 K.

