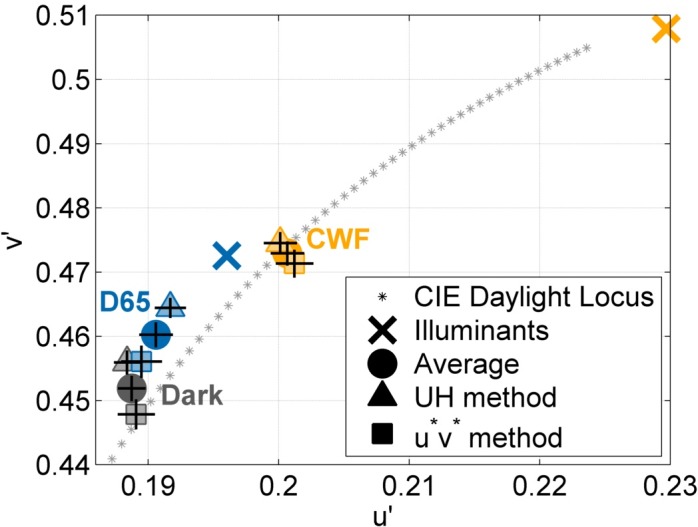
Figure 2.

Achromatic loci averaged over all 30 observers and all test luminance levels. Error bars denote ±1 standard error of the mean. Gray symbols denote the mean settings under the Dark viewing condition, blue symbols under the D65 condition, and yellow symbols under the CWF condition. The settings for the UH method and the u*v* method are indicated by ▴ and ▪, respectively, while • denotes the mean setting under each illuminant.
