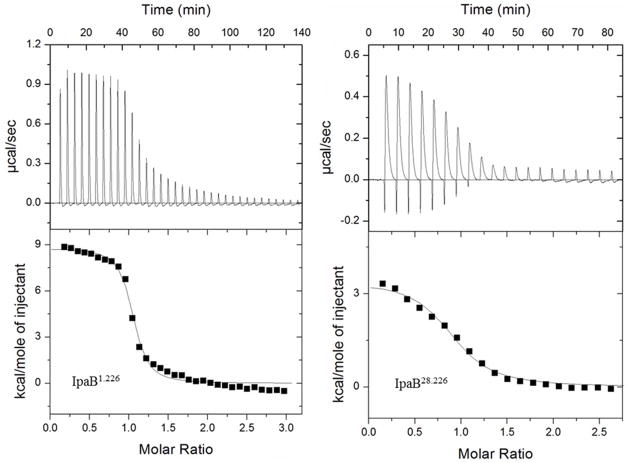
Figure 3. Isothermal titration calorimetry (ITC) measurements for IpgC and IpaB fragments.
Titrations of IpgC with IpaB1.226 (left panel) and IpaB28.226 (right panel) as monitored by ITC. The upper panel of each section depicts the thermograms obtained during the course of each injection series. The corresponding integrated enthalpy changes (after background correction) are shown in each lower panel. A solid line is depicted in the lower panel that fits the data according to a single-site binding model. Experimentally derived thermodynamic values are listed in Table 3.

