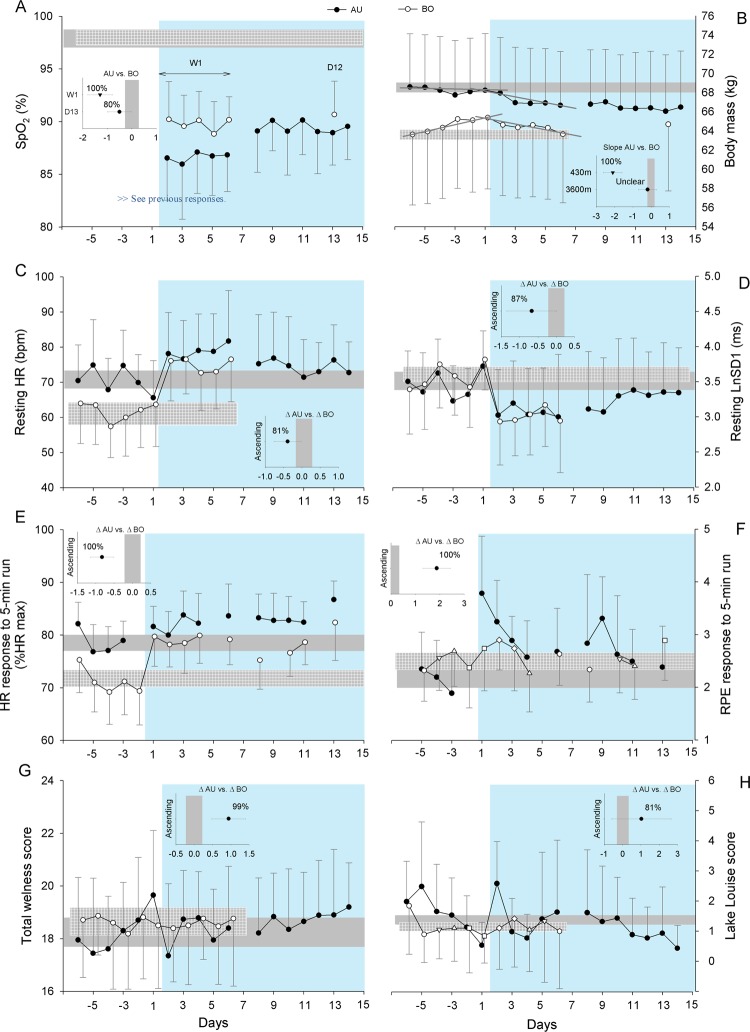
Figure 2.
Values are presented as mean±SD for the Australian (AU) and Bolivian (BO) teams. Changes in arterial oxygen saturation (SpO2, A), body mass (panel B), resting heart rate (HR, C), resting vagal-related HR variability (LnSD1, D), HR response to the 5-min submaximal run (panel E), rate of perceived exertion (RPE) response to the 5-min submaximal run (panel F), total wellness (panel G) and Lake Louise scores (H). The green background area represents time spent at altitude (3600 m). The grey horizontal bars indicate the magnitude of trivial changes for both teams (see methods). The small inserted graphs for SpO2 and body mass show the between-group standardised differences in mean SpO2 values during the first week (W1) and on day 13 (D13), and body mass slopes (90% CIs)/chance for this differences to be greater than the smallest worthwhile difference (represented by the vertical grey bars, see methods). The inserted graphs for the six other variables show the between-group standardised differences in the change immediately after ascent (90% CIs), that is, average of the last two days versus first day at altitude/chance for these differences to be greater than the smallest worthwhile difference (represented by the vertical grey bars, see methods).

