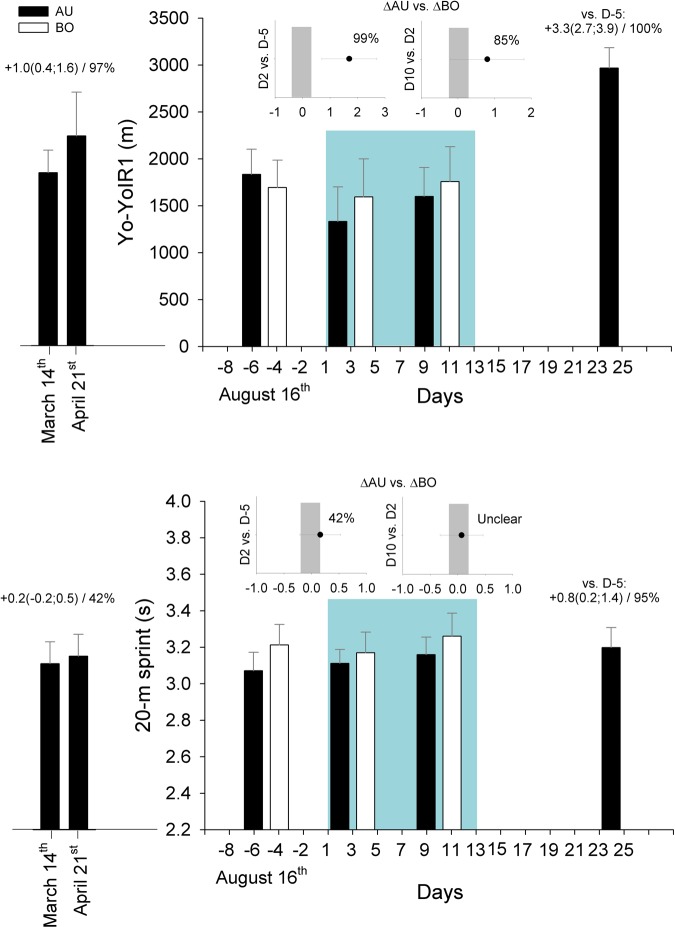
Figure 3.
Changes in Yo-Yo Intermittent Recovery test level 1 (upper panel) and 20 m sprint time (lower panel) for the Australian (AU, n=13) and Bolivian (BO, n=15) players. The inserted graphs show the between-group standardised difference in the change (90% CIs)/chance for this difference to be greater than the smallest worthwhile difference (represented by the vertical grey bars, see methods). The data from six AU players, who were also tested before and after a 5.5-week period preceding the camp (March–April 2012), and 11 days after the camp, are presented as complementary data. Numbers indicate within-group standardised changes in performance (90% confidence limits)/chance for these changes to be greater than the smallest worthwhile change. The green background area represents time spent at altitude (3600 m).

