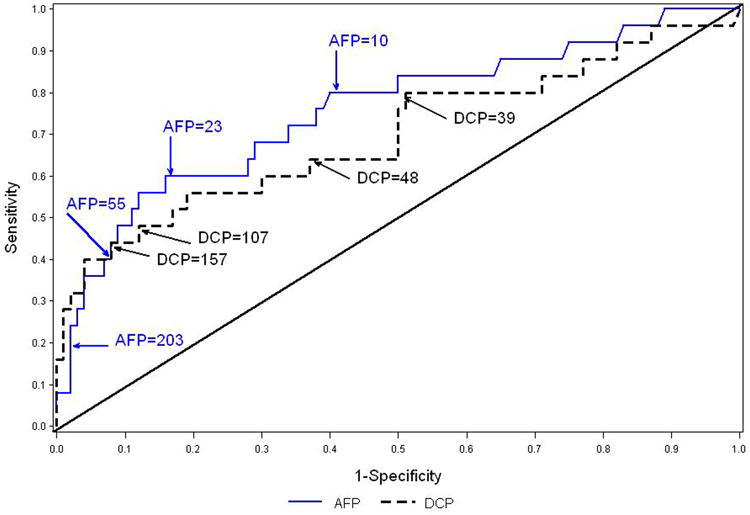
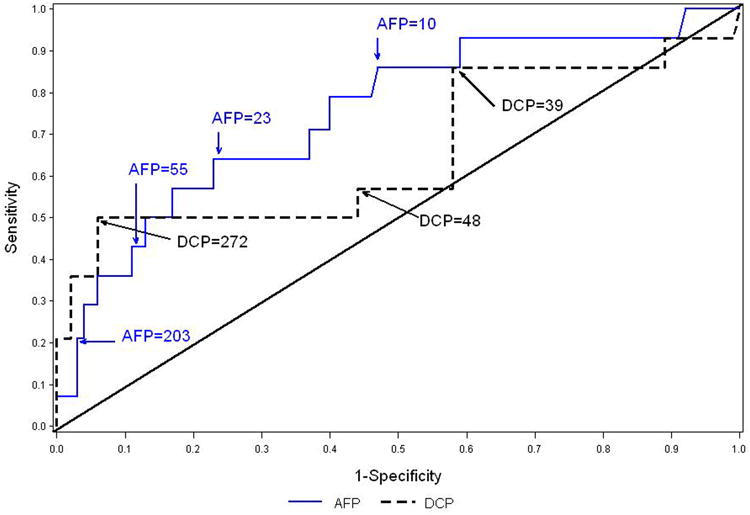
Figure 2.


Figure 2a. ROC curves for maximum AFP and DCP between months 37 and 48 as predictors of HCC during months 37-60. The analysis includes 743 patients, 25 of whom developed HCC. The areas under the ROC curve are 0.76 for AFP and 0.70 for DCP. Figure 2b. ROC curves for maximum AFP and DCP between months 37 and 48 as predictors of HCC during months 37-60 for patients with cirrhosis at S00 or M24. The analysis includes 378 patients, 20 of whom developed HCC. . The areas under the ROC curve are 0.75 for AFP and 0.66 for DCP.
