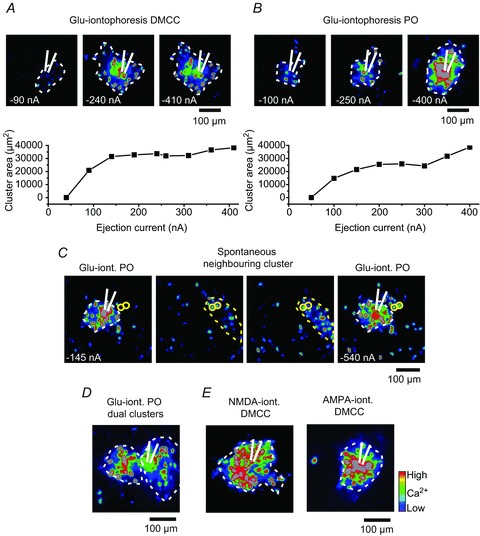
Figure 3.

Glutamate-induced cluster formation in the DMCC and PO A, upper panels: Z-projection ΔF images (maximum values over 10 frames) at the time of glutamate iontophoresis (net ejection current is noted in the lower left corner) with a glass pipette positioned in the DMCC (white lined tip). Lower panel: plot of injection current versus DMCC cluster area. B, Z-projection ΔF images at the time of glutamate iontophoresis with a glass pipette positioned in the PO. Lower panel: plot of injection current versus PO cluster area. Note that the cluster area reaches a plateau in the DMCC and PO. C, Z-projection images of glutamate-induced PO cluster (white dotted line; iont., iontophoresis), and a repeating spontaneous neighbouring cluster (yellow dotted line). Note that two neurons in the spontaneous cluster (yellow circles) are also activated at the outer rim of the glutamate-induced cluster at the strongest glutamate iontophoresis (rightmost panel). D, Z-projection ΔF images of glutamate-induced dual PO clusters. E, Z-projection ΔF images of NMDA- and AMPA-induced cluster formation in the DMCC. Blue, low calcium; red, high calcium (applies to all images).
