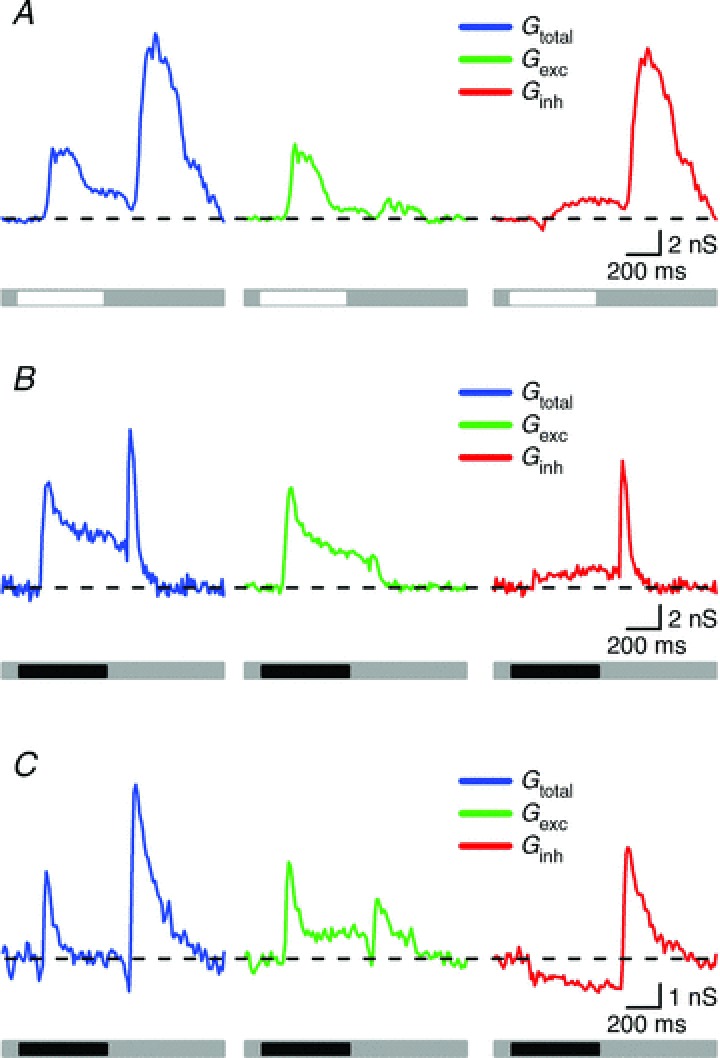
Figure 2. Synaptic conductance measurements for three RGCs in response to stimulation with an optimal size stimulus.

A, representative synaptic conductance of an ON cell consisting of an increase in total conductance (blue trace) upon presentation and removal of a stimulus of preferred contrast. Excitation showed a large increase at stimulus onset and a small change at stimulus offset (green trace) and inhibition slightly developed at stimulus onset but greatly increased at stimulus termination (red trace). B, light-evoked conductances in an OFF-RGC that responded with increases in total membrane conductance at both phases of stimulus presentation (blue trace). Excitation showed a large increase at stimulus onset and a small increase at stimulus offset (green trace) whilst inhibition showed a mild but sustained increase at stimulus onset and a transient and large increase at stimulus offset (red trace). C, this OFF-RGC displayed increases in total conductance at both stimulus onset and offset (blue trace). Excitation was characterised by an increase at both stimulus phases (green trace) whilst the inhibitory conductance was reduced at stimulus onset (disinhibition) and showed a great increase at stimulus offset (red trace).
