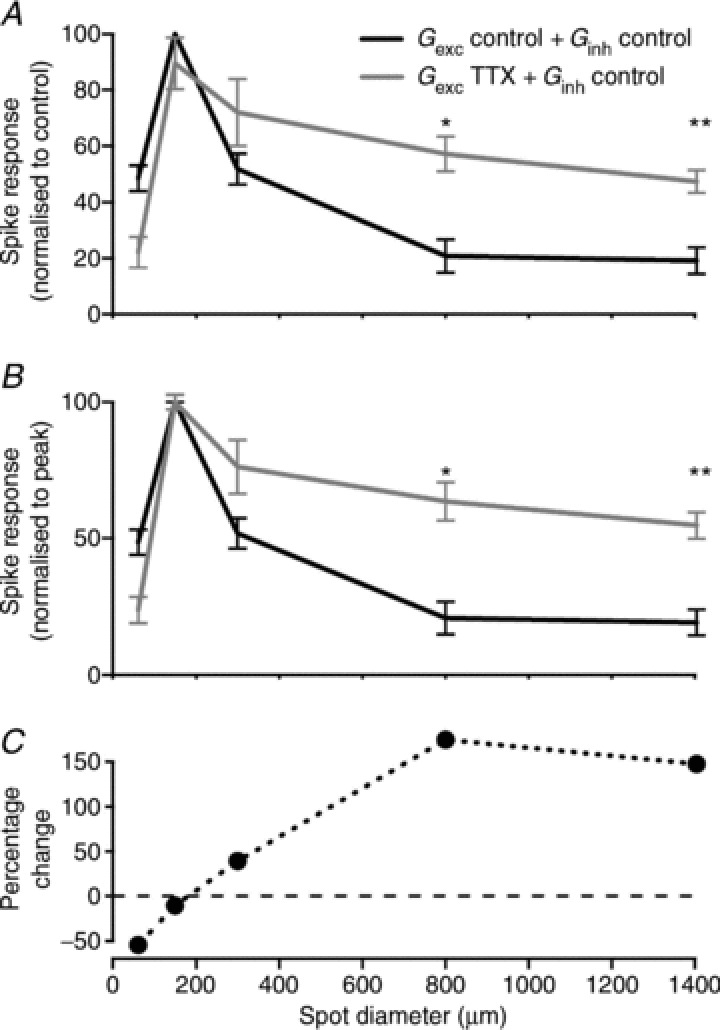
Figure 8. Quantification of the effect of removing TTX-mediated inhibition on bipolar cells.

Average area–response functions: bottom curves show responses normalised to their own peak response in response to control excitation and inhibition (black) and in response to injection of control excitation and inhibition recorded under TTX (grey). Note the reduction in surround inhibition. Top curves show responses normalised to the peak response elicited by injection of control excitation and inhibition (black). Note the overall increase in response strength in addition to the reduction in surround inhibition (grey trace). n= 9 cells; *P < 0.05; **P < 0.01.
