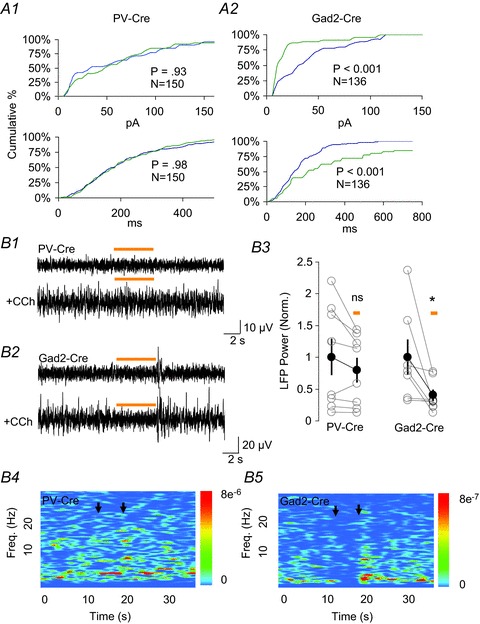
Figure 3. Optogenetic silencing of parvalbumin (PV) cells does not alter inhibitory postsynaptic currents (IPSCs) or local field potentials (LFPs) induced by carbachol (CCh).

A, cumulative percentage distributions of spontaneous IPSC amplitudes (A1, A2; top plots) and inter-event intervals (A1, A2; bottom plots) in PV-halorhodopsin (NpHR) and glutamic acid decarboxylase 2 (Gad2)-NpHR slices. Each plot was generated from three cells each from PV- or Gad2-Cre mice, using an equal number of events (see graph insets) from each cell. Blue and green traces were taken from 5 s of recording immediately preceding and during NpHR activation, respectively. Kolmogorov–Smirnov tests were used to determine the significance of differences in the distributions. There was no difference between the datasets in A1, top or bottom. The differences in the datasets in A2 (top and bottom) were significant at P < 0.01. B1, B2, representative local inhibitory LFPs under baseline conditions (upper) and after application of CCh (lower) in the CA1 pyramidal layer of PV-Cre mice (B1) or Gad2-Cre mice (B2) injected with adeno-associated virus (AAV)-NpHR-enhanced yellow fluorescent protein (EYFP). Activation of NpHR does not affect the LFP in PV-Cre mice (B1), but reversibly suppresses the LFP in Gad2-Cre mice (B2). B3, group data for effects of PV-NpHR and Gad2-NpHR activation on the summed spectral power from 2–5 Hz of LFPs induced by CCh. The effects of activating NpHR were assessed using paired t tests. In PV-Cre mice there was no significant reduction (to 89.7 ± 6.8% of the control value; P= 0.17), whereas in Gad2-Cre mice the reduction was significant (P= 0.04, reduction to 65.0 ± 11.7% of the control value). The group means and s.e.m. (black symbols and lines) are presented for illustrative purposes only. B4, B5, spectrograms generated for the traces shown in B1 and B2. The colour scales are in units of μV2 Hz−1. Black arrows denote the light pulse.
