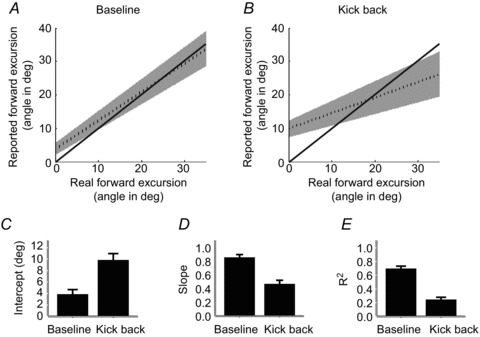
Figure 2. A voluntary kick back alters reflex perception.

A and B, group mean linear regression line (dashed) with 95% confidence intervals in the baseline (A) and kick back (B) conditions. Solid line depicts the hypothetical ideal observer. C–E, when kicking back, data from the 21 volunteers show consistent increases in the intercept (C), and reduction in slope (D) and R2 values (E) compared to the baseline condition. The bar plots display group means ± SEM. All pairs were significantly different (P < 0.05). For significance levels, see main text.
