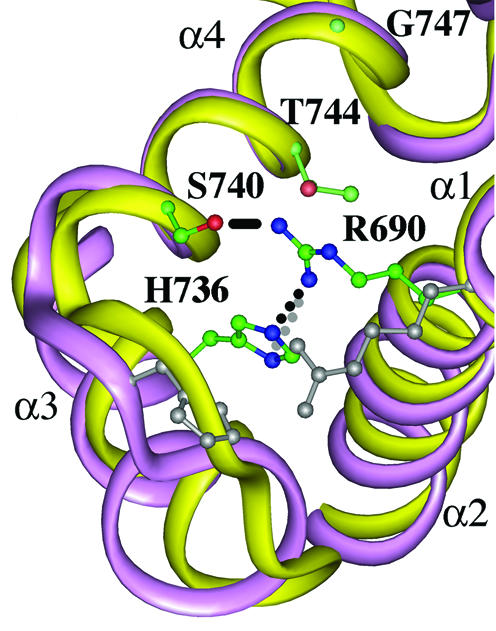
Figure 6.

Structural model of S.cerevisiae DNA topoisomerase II. Yellow and purple ribbons represent a part of the breakage/rejoining domain of S.cerevisiae DNA topoisomerase II (α1–α4 helices, 2) and the corresponding domain of E.coli gyrase (4), respectively. S.cerevisiae Arg690 (corresponding to human Arg713), His736 (His759), Ser740, Thr744 and Gly747 (Asn770) are visualized with balls and sticks. Carbon, nitrogen and oxygen atoms are in green, blue and red, respectively. The distances between the guanidinium nitrogen of Arg690 and the δ1 nitrogen of His736, the guanidinium nitrogen of Arg690 and the ε2 nitrogen of His736, and the guanidinium nitrogen of Arg690 and the oxygen of Ser740 are 3.13 (gray dotted line), 3.16 (dotted line) and 3.78 Å (solid line), respectively. E.coli counterparts of Arg690 (Arg32) and His736 (His80) are also shown in gray. The drawing was made by using Insight II.
