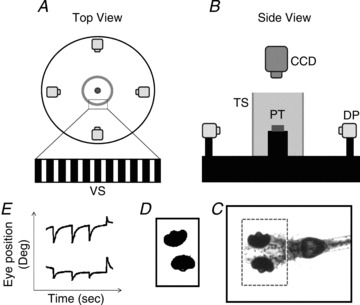
Figure 1. Schematic diagram of the experimental setup and the image analysis process.

Top view (A) and side view (B) of the experimental setup. C, recorded image of the whole body of the larval zebrafish. The dashed square indicates the ROI. D, the eye balls were identified and analysed to obtain eye movements. E, eye movement in space. DP, digital projector; CCD, IR-sensitive CCD camera; TS, translucent screen; VS, visual stimulus; PT, plastic tube.
