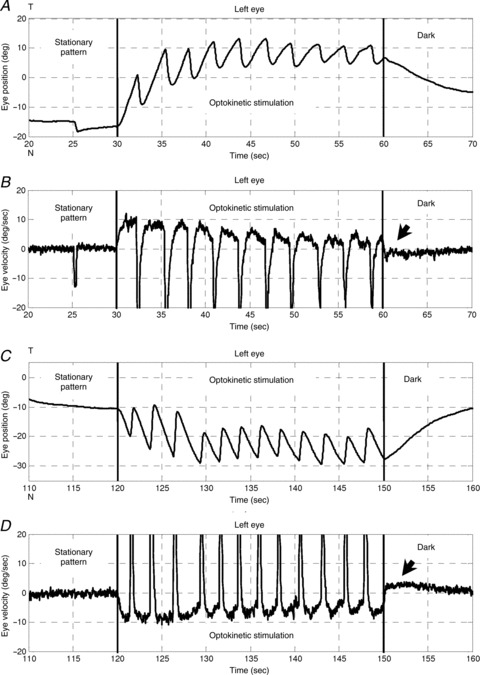
Figure 3. OKR of a zebrafish larva .

Optokinetic stimulation was 10 deg s−1 in the nasal-to-temporal direction (30–60 s) and 10 deg s−1 in the temporal-to-nasal direction (120–150 s). A and C, left eye position versus time. B and D, left eye velocity versus time. Arrows indicate the OKAR in the velocity domain. T, temporal; N, nasal.
