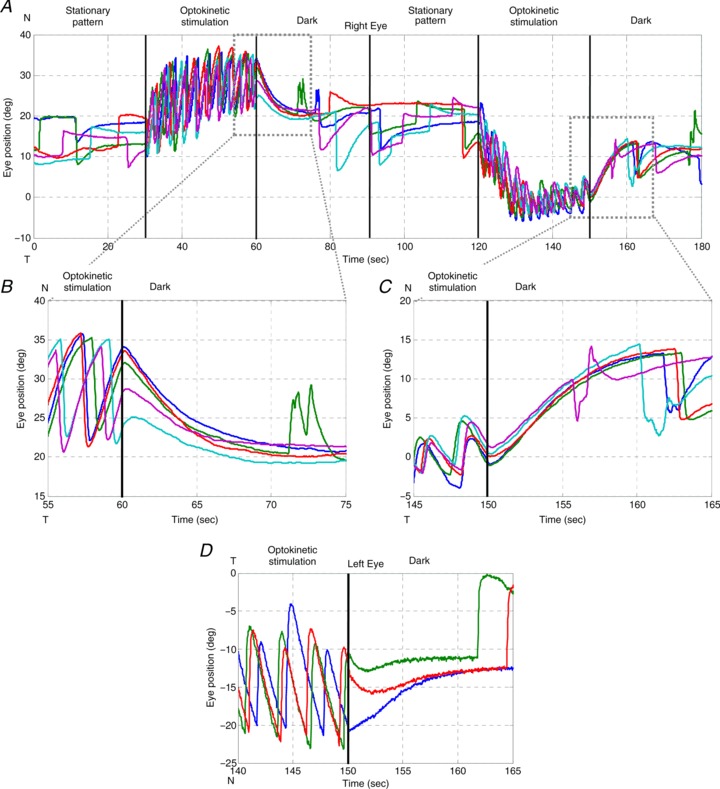
Figure 4. OKAR of a zebrafish larva .

Visual stimuli over time: 0–30 s, stationary vertical gratings; 30–60 s, vertical gratings rotating horizontally at a constant angular velocity of 10 deg s−1 in one direction; 60–90 s, dark period. At 90–180 s, the same procedure was repeated with the optokinetic stimulus moving in the opposite direction (120–150 s). Different colours indicate different trials. A, typical eye position trace of a larval zebrafish during the OKR and OKAR tests. B and C, magnifications of Fig. 4A. D, another example of OKAR. The green and red lines indicate that OKAR continued in the direction of the OKR for 2–3 s while the blue line turned to the opposite direction immediately.
