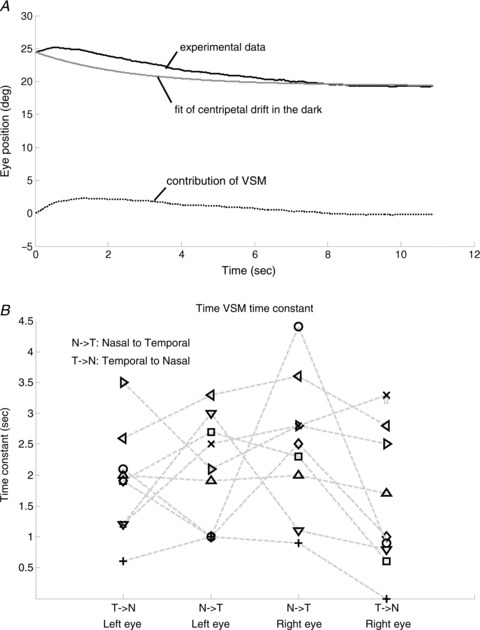
Figure 6. Estimation of time constant of the VSM.

A, the black line represents the OKAR obtained from experimental data. The grey line represents predicted eye position from the analysis of drift behaviour in the dark. The dotted line represents the contribution of the VSM, used for computing the time constant of the VSM by iterative fitting. B, the estimated median time constants of the VSM of all larvae (n= 10). Note that one larva has only two time constants of the VPNI due to absence of eye movements in one direction (see Fig. 4D). In this case, the time constant of the VSM could not be estimated. Nine larvae had four values indicating the median time constant of two eyes in two directions. Values of each fish, except for the one with only two data points, are connected by a dashed line.
