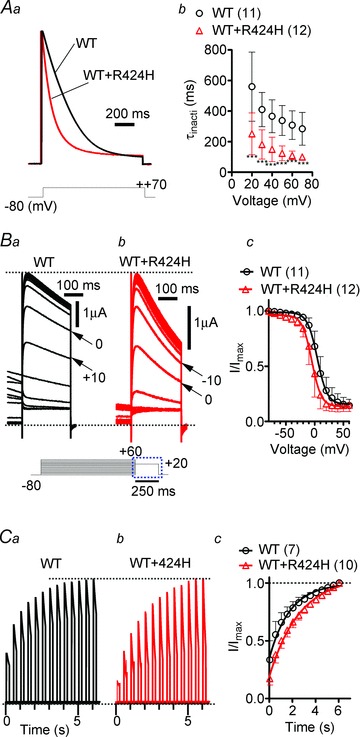
Figure 1. Coexpression of R424H mutant and wild-type (WT) subunits in Xenopus oocytes accelerates the inactivation kinetics and slows the recovery from inactivation compared with WT subunits alone.

Aa, representative traces evoked by stepping from a −80 mV holding potential to +70 mV. The current traces are scaled to the same peak amplitude. Ab, the plots of the inactivation time constant (τinacti) were determined by fitting the falling phases of currents obtained in Supplemental Fig. S2A with a single exponential function. Ba and b, comparison of steady-state inactivation, which was obtained by changing the membrane potential from a prepulse potential ranging from −80 to +60 mV in 10 mV increments to a test voltage step of +20 mV to record tail currents. Ba and b shows traces of tail currents, and their corresponding voltage pulses are given under the traces surrounded by the dotted rectangle. Bc, the tail current amplitudes were normalized to the maximal current, and the resulting plots were fitted with the Boltzmann function, I/Imax= 1/[1 + exp(V−V1/2)/k], where k is a slope factor. C, recovery from inactivation in WT channels and WT+R424H mutant channels. Ca and b, the recovery time constant (τrecove) was determined by depolarizing the cells to +50 mV for 1000 ms from a holding potential of −80 mV. A step to −80 mV of variable duration was followed with test pulses to +50 mV for 200 ms in 500 ms increments. Cc, time course of the recovery from inactivation. The curves were fitted with a single exponential function to obtain τrecove. Here and in the following figures, error bars indicate standard deviation, the numbers in parentheses indicate the number of experiments, and statistical significance was tested using Mann-Whitney’s U test unless otherwise stated (significance, P < 0.05). ***P < 0.001.
