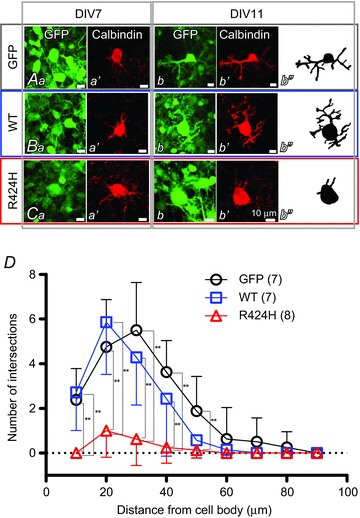
Figure 3. R424H mutant-expressing PCs exhibit impaired dendritic development.

A–C, immunofluorescence images of PCs expressing GFP alone (Aa–b′), WT subunits and GFP (Ba–b′) and R424H mutant subunits and GFP (Ca–b′). Ab′′, Bb′′ and Cb′′, morphology of PCs expressing GFP (Ab′′), WT subunits and GFP (Bb′′) and R424H mutant subunits and GFP (Cb′′) are depicted for clarity. Each PC was traced using Neurolucida software. D, summary of dendrite complexity measured by Sholl analysis. Concentric spheres were centred on the cell body, and the radii were incremented by 10 μm. The number of branching points within each sphere was plotted as dendrite complexity (i.e. the number of intersections). **P < 0.01.
