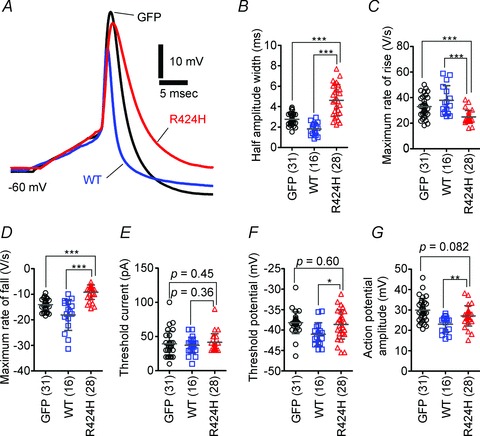
Figure 6. R424H mutant-expressing PCs exhibit broadened action potential waveforms.

A, representative single action potential waveforms of PCs. The action potentials were evoked by short depolarizing current injection (10 ms duration). Action potentials were aligned by superimposing the rising phase of each trace. The resting membrane potentials were adjusted to −60 mV by current injection. B–G, comparison of action potential properties. B, half-amplitude width measured at the mid-point between the threshold and peak of the action potential. C and D, maximal rate of rise (C) and of fall (D) of action potentials. E, threshold current amplitude. F, threshold potential. G, action potential amplitude, as measured between the threshold and peak. *P < 0.05, **P < 0.01 and ***P < 0.001.
